Dollar continues to strengthen
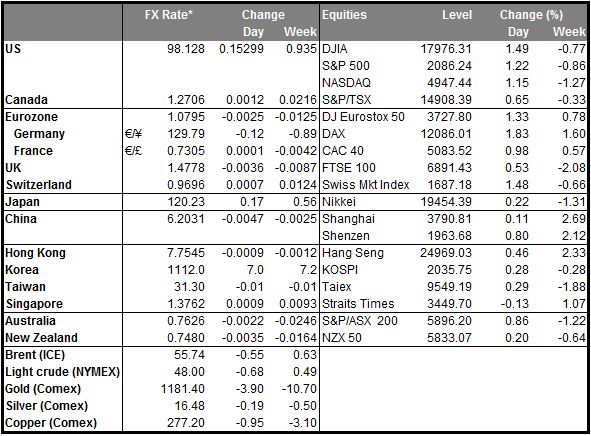
End-month and end-quarter demand pushed the dollar higher Monday. Much of the demand was apparently due to such position-squaring rather than fresh risk-taking. Fed funds rate expectations were largely unchanged and bond yields declined a modest 2 bps, so it was not due to any large change in understanding of the Fed’s view. Today being the last day of the month and quarter, we could see continued demand. The question then is, will it continue on Wednesday when April begins? I expect so. In contrast to what we’ve been seeing over the past several weeks, the recent US economic indicators have generally been good. Yesterday’s February personal income and pending home sales both beat estimates (although personal spending was below forecast), suggesting that perhaps US indicators are perhaps starting to improve (although of course one day does not make a trend). In any case, the market is likely to start looking forward to another strong US payrolls figure this Friday which, coming out on a thin holiday day, may have a greater-than-usual impact on the dollar.
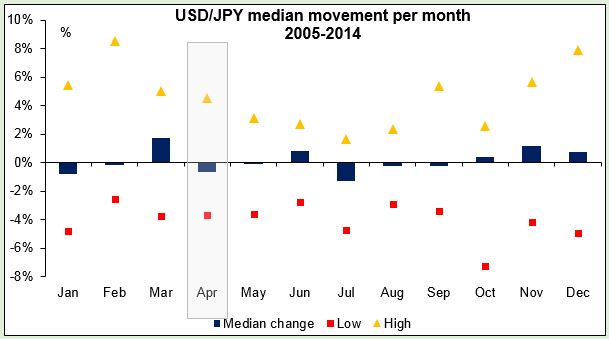
USD/JPY seasonal pattern in April Following the above discussion of seasonal patterns, I was going to write a sentence or two about how USD/JPY was likely to move higher in April. Although the seasonal repatriation of Japanese funds in March ended years ago with the introduction of consolidated accounting, the outflow of funds in the new fiscal year beginning in April is still a real phenomenon. That’s because people and companies make payments to insurance and pension funds at the beginning of the new fiscal year in April and investment companies put into effect their new investment plans starting in the month. However when I looked at the seasonal pattern, I found that unfortunately, reality did not agree with theory: in fact, USD/JPY has over the last decade tended to move lower in April, not higher (i.e., JPY tended to strengthen). However, the hit ratio is so evenly balanced (6 years down, 4 years up) and the range between the largest decline (-3.7%) and largest rise (+4.5%) is so large as to suggest that there is no dominant seasonal trend. In that case, I think the determining factor for JPY this year will be continued capital outflows as the Bank of Japan buys up all the Japanese Government Bonds, leaving investors to look overseas for investment opportunities.
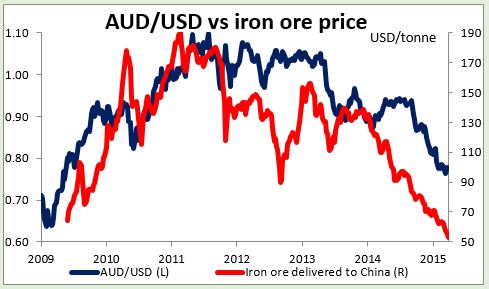
AUD/NZD moving towards parity AUD was the big loser overnight as investors start thinking about the possibility of AUD/NZD, already at historic lows, moving towards parity. The country’s domestic data released Monday was not that bad: HIA new home sales were up 1.1% mom in February, a slowdown from January but still rising, while private sector credit expanded at the same yoy pace as in January. However the external environment is deteriorating, and that’s what’s affecting AUD. Monday the price of iron ore fell to its lowest since May 2009. Does anyone need a reminder of just how bad the global economy was in May 2009? China will release its official March manufacturing PMI on Wednesday and the market expects another reading below 50, which would be the third in a row. With oil prices down as well, the outlook for commodity producers is not that great right now. The RBA meets on April 7th and the market is now pricing in a 79% likelihood of a cut in rates at the meeting, up from 68% a week ago. AUD seems to be the #1 currency in the firing line.
Today’s highlights: During the European day, eurozone’s flash CPI for March and unemployment rate for February are coming out. The turn of the German inflation rate to positive on Monday increased the likelihood that the bloc’s deflation could moderate somewhat. This could prove EUR-supportive. However, following the introduction of the quantitative easing program by the ECB, the impact of the CPI on EUR is not as great as it used to. Thus the reaction in the markets could be limited. German unemployment for March is also due out.
In the UK, the 3rd estimate of Q4 GDP is released. The final estimate of GDP figure is expected to confirm the preliminary reading, therefore the market reaction is likely to be minimal as usual.
In the US, we get S & P/Case-Shiller house price index for January, which is expected to have decelerated from December but still show house prices rising. Chicago purchasing managers’ index and the Conference Board consumer confidence index both for March are also to be released. These are likely to keep confidence up and the USD supported.
From Canada, the monthly GDP for January is expected to contract a bit, a turnaround from the previous month. This is expected to cause the annual growth rate to decelerate and keep CAD under selling pressure.
We have several Fed speakers on Tuesday’s agenda: Richmond Fed President Jeffrey Lacker, Atlanta Fed President Dennis Lockhart, Cleveland Fed President Loretta Mester and Kansas City Fed President Esther George speak. ECB Supervisory Board Chair Daniele Nouy testifies before the European Parliament economic and monetary affairs committee.
The Market
EUR/USD breaks below the short-term uptrend line
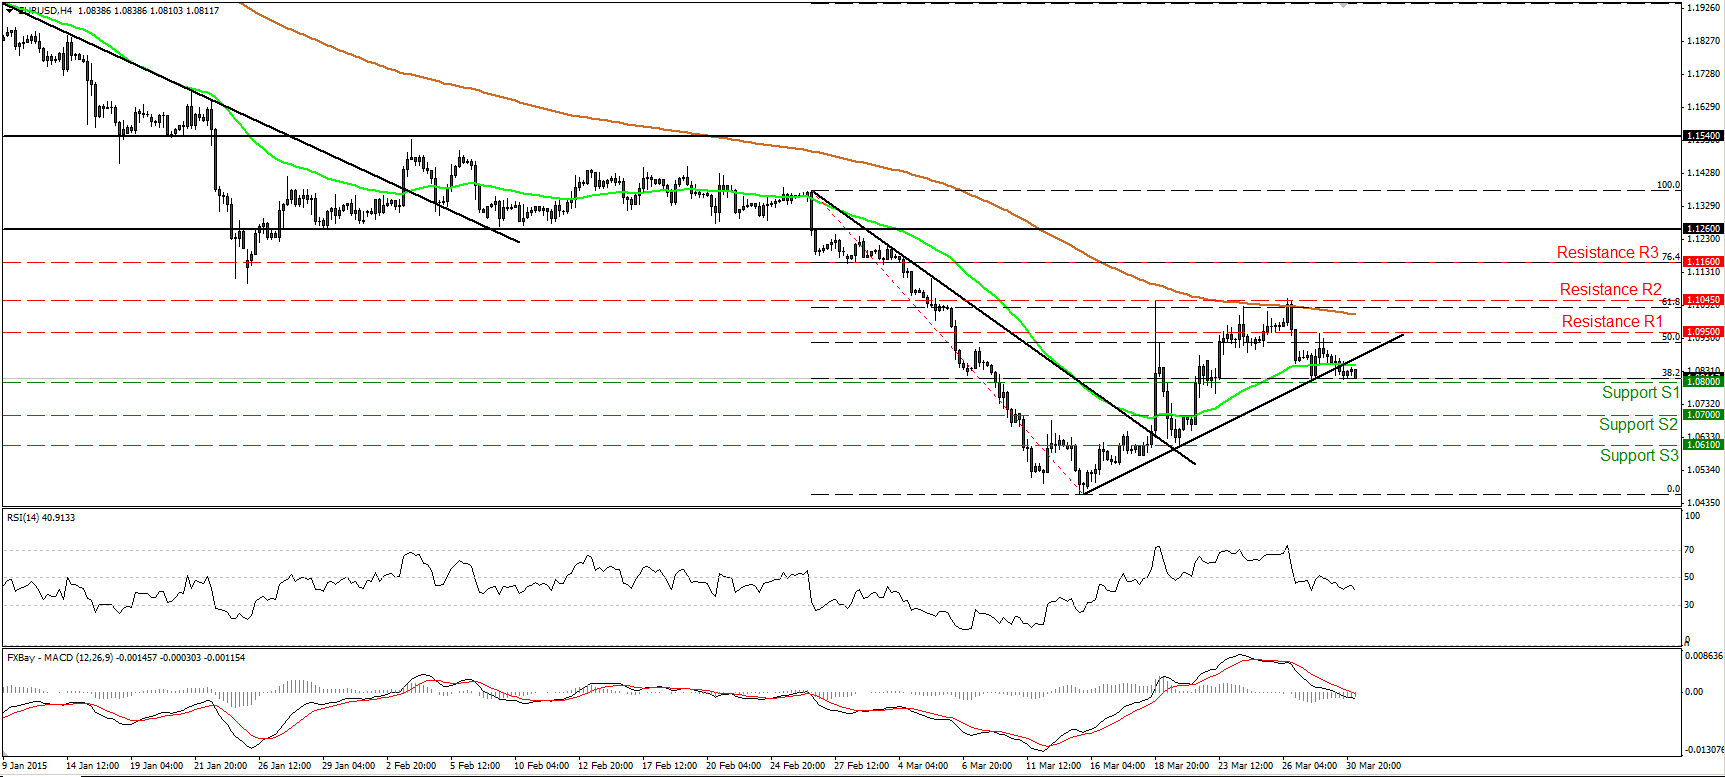
EUR/USD traded lower on Monday and fell below the short-term uptrend line taken from the low of the 13th of March. During the early European morning Tuesday, the rate is trading fractionally above the 1.0800 (S1) support hurdle, where a decisive dip could turn the short-term bias to the downside in my view. Such a break is likely to set the stage for extensions towards our next support obstacle at 1.0700 (S2). Our momentum studies support the notion. The RSI continued lower after finding resistance at its 50 line, while the MACD, already below its trigger line, obtained a negative sign. As for the broader trend, I still see a longer-term downtrend. The pair is forming lower highs and lower lows below both the 50- and the 200- day moving averages. As a result, I would treat the recovery from 1.0460 as a corrective phase of the larger down path.
• Support: 1.0800 (S1), 1.0700 (S2), 1.0610 (S3).
• Resistance: 1.0950 (R1), 1.1045 (R2), 1.1160 (R3).
USD/JPY trades above 120.00 again
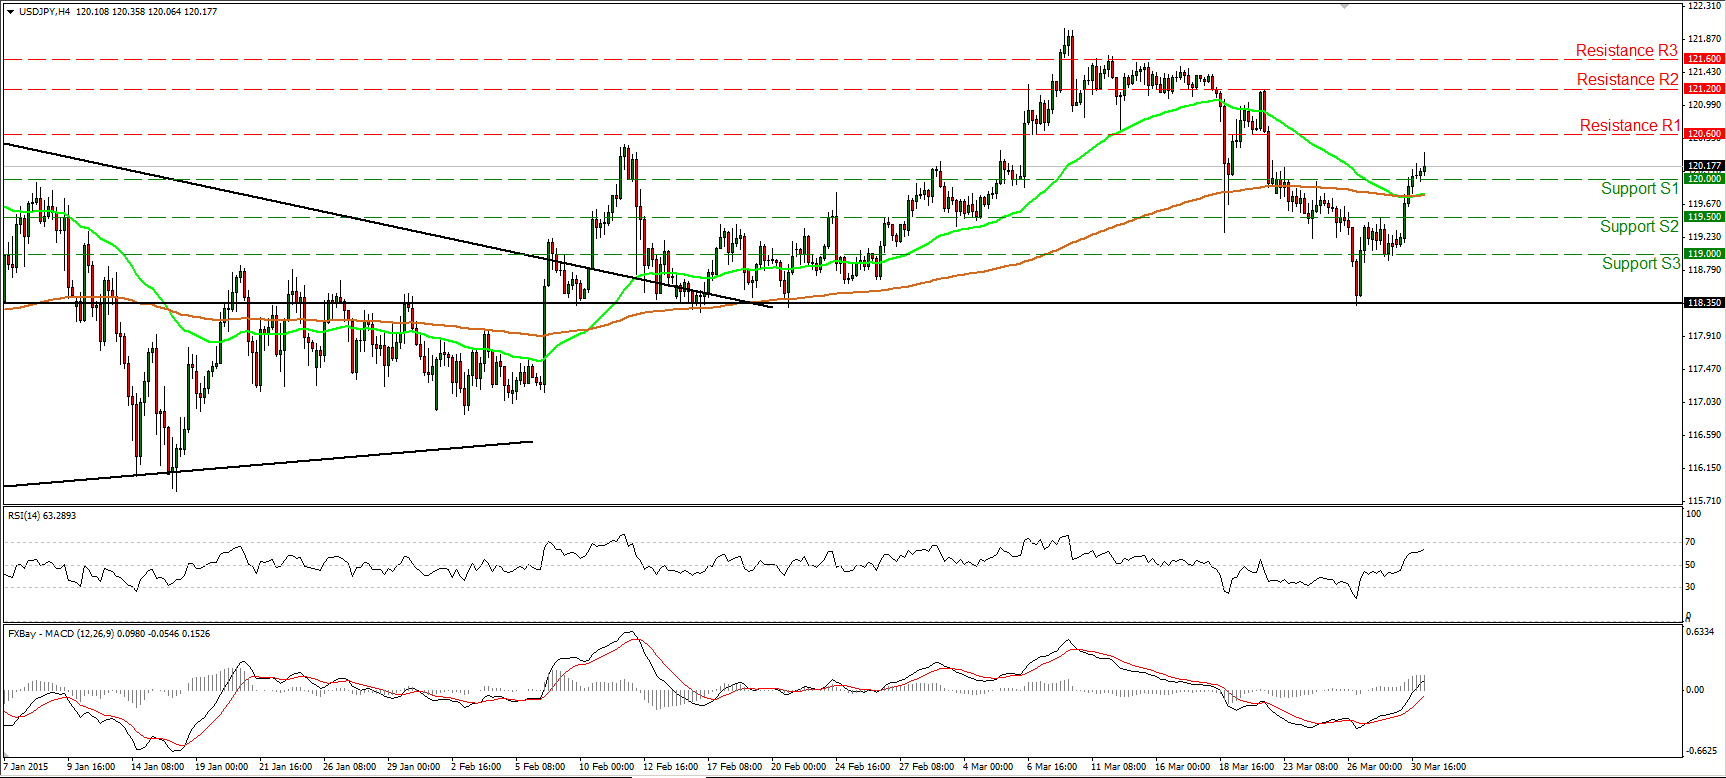
USD/JPY raced higher yesterday to trade back above the 120.00 (S1) obstacle. After the strong rebound from 118.35, the short-term bias has turned positive in my view. Therefore, I would expect buyers to challenge the resistance of 120.60 (R1) in the near future. A clear move above that line could extend the bullish wave and perhaps target the 121.20 (R2) barrier. The RSI edged up after crossing above its 50 line and is now heading towards its 70 line, while the MACD, already above its trigger, has turned positive and points north. As for the broader trend, the rate is still trading above the upper bound of the triangle that had been containing the price action since November, and is back above both the 50- and the 200-day moving averages. This keeps the overall picture of USD/JPY positive. Nevertheless, I see negative divergence between our daily oscillators and the price action. A break above the 122.00 hurdle is the move that would confirm a forthcoming higher high on the daily chart and perhaps signal the continuation of the large uptrend.
• Support: 120.00 (S1), 119.50 (S2), 119.00 (S3).
• Resistance: 120.60 (R1), 121.20 (R2), 121.60 (R3).
USD/CAD continues higher
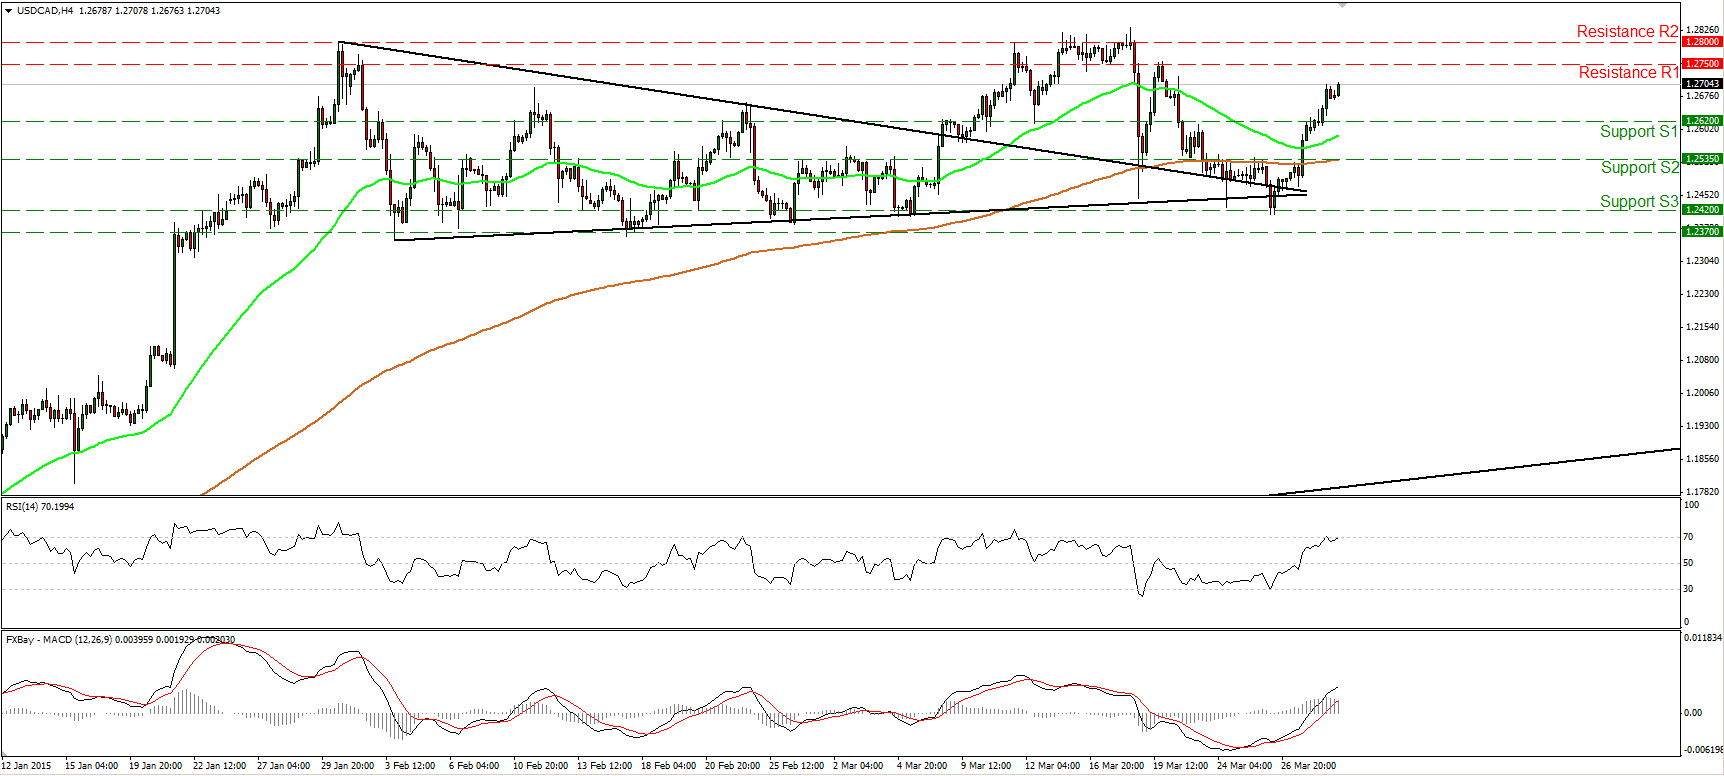
USD/CAD kept rising on Monday and managed to move above the resistance (turned into support) line of 1.2620 (S1). During the European morning Tuesday, the pair is heading towards 1.2750 (R1), where an upside break could target again the critical hurdle of 1.2800 (R2). Our short-term oscillators detect accelerating bullish momentum and amplify the case for further advances. The RSI edged higher and poked its nose above its 70 line, while the MACD continued surging above both its zero and signal lines. Switching to the daily chart, the rate is still trading above the 50- and 200-day moving average. Moreover, the rebound from the 50-day moving average and from the apex of the triangle that had been containing the price action since the beginnings of February gives an extra signal of trend continuation. Therefore, the overall trend of this pair stays to the upside, in my opinion.
• Support: 1.2620 (S1), 1.2535 (S2), 1.2420 (S3).
• Resistance: 1.2750 (R1), 1.2800 (R2), 1.2900 (R3).
Gold continues its tumble
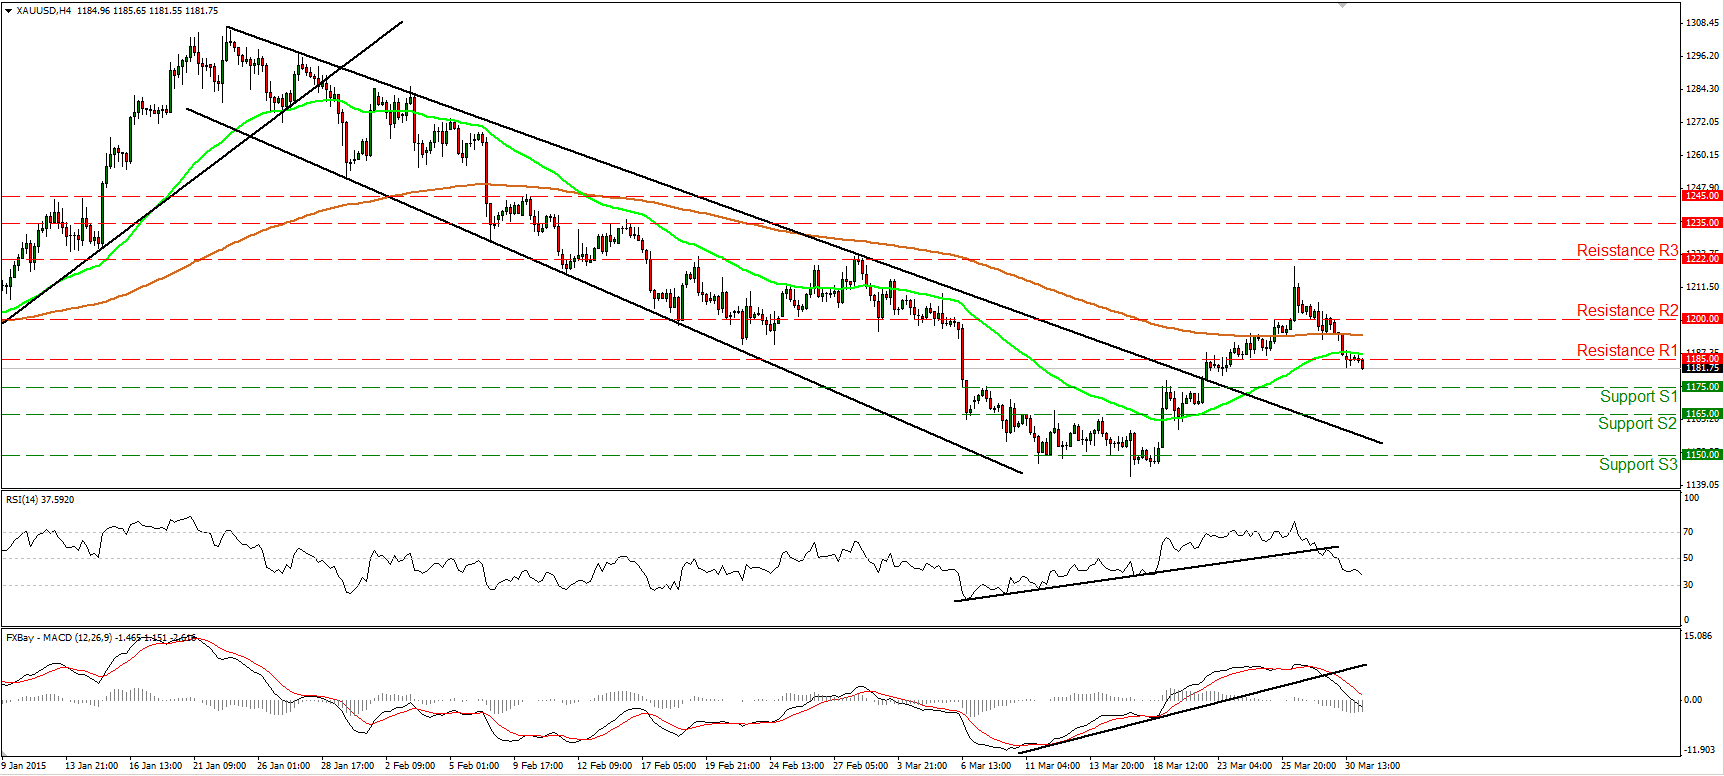
Gold continued sliding on Tuesday, falling below the support (now turned into resistance) barrier of 1185 (R1). Taking into account our momentum signs, I would expect the tumble to continue and challenge our next support line at 1175 (S1). The RSI headed south after falling below its 50 line, while the MACD, already below its upside support line and below its trigger line, entered its negative field. As far as the bigger picture is concerned, since the peak at 1307, the price structure has been lower highs and lower lows. The recent declines support the case that the 17th - 26th March recovery was just a corrective move which is probably over now.
• Support: 1175 (S1), 1165 (S2), 1150 (S3).
• Resistance: 1185 (R1), 1200 (R2), 1222 (R3).
WTI in a consolidative mode
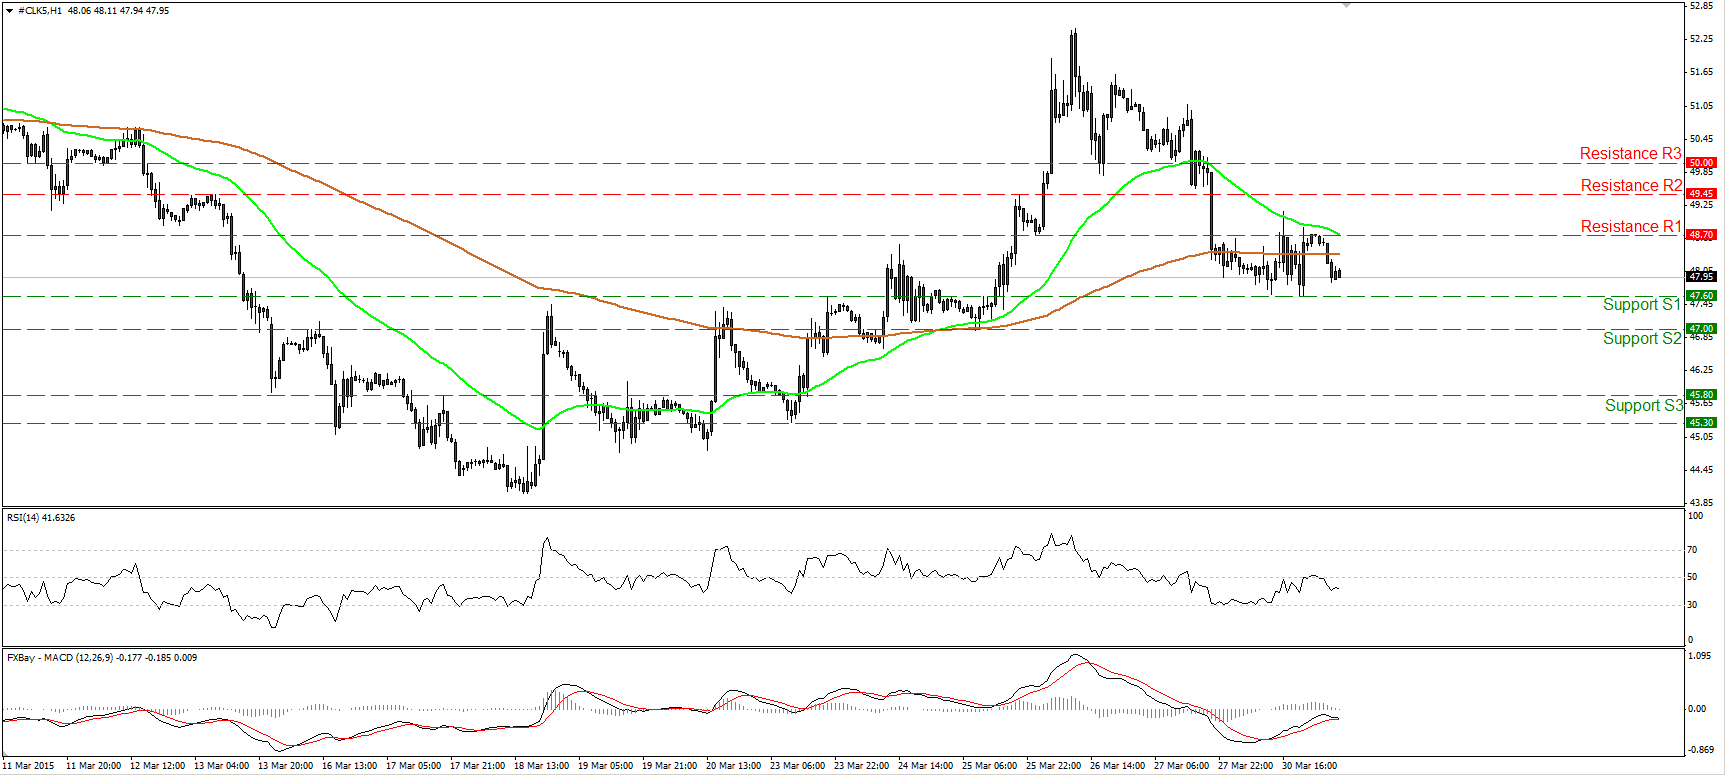
WTI moved in a consolidative mode on Monday, staying between the support of 47.60 (S1) and the resistance hurdle of 48.70 (R1). I hold the view that the outlook on the 1-hour chart is negative, and I would expect the bears to drive the battle below the 47.60 (S1) line and target the next obstacle of 47.00 (S2). Our hourly momentum studies corroborate my view. The 14-hour RSI hit resistance near its 50 line and turned down, while the hourly MACD, already negative, shows signs of bottoming and could move below its trigger any time soon. On the daily chart, WTI is trading well below the 200-day moving average and is now back below the 50-day one. This keeps the longer-term downtrend still intact. Nevertheless, there is positive divergence between the daily oscillators and the price action. Therefore, I would prefer to wait for price and momentum alignment before getting confident again on the larger down path.
• Support: 47.60 (S1), 47.00 (S2), 45.80 (S3).
• Resistance: 48.70 (R1) 49.45 (R2), 50.00 (R3).

