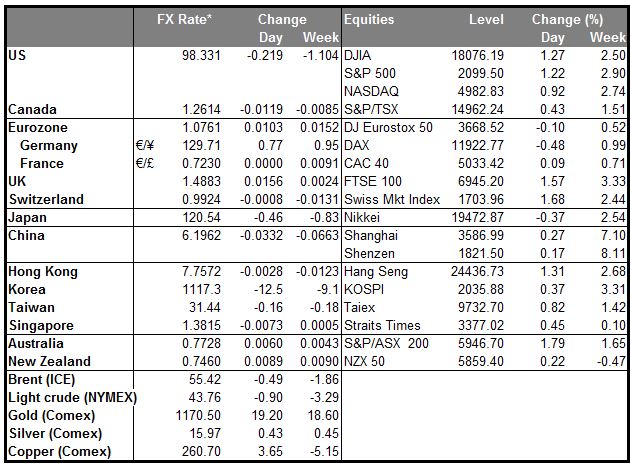
Lower “maximum employment” and inflation leads to slower rate hikes leads to massive USD profit-taking The FOMC meeting went pretty much as I had expected, but the market reaction was much greater than I had anticipated. The range in EUR/USD was 4.38%, the biggest since 4.89% in Sept. 2000, when the ECB intervened in the market to support the euro (it was below 0.90 then). Moreover, the carnage in the markets lasted a significant length of time, not the usual five-minute frantic trading before settling down.
As expected, the statement eliminated the “patient” phrase and replaced it with Consistent with its previous statement, the Committee judges that an increase in the target range for the federal funds rate remains unlikely at the April FOMC meeting. The Committee anticipates that it will be appropriate to raise the target range for the federal funds rate when it has seen further improvement in the labor market and is reasonably confident that inflation will move back to its 2 percent objective over the medium term. This change in the forward guidance does not indicate that the Committee has decided on the timing of the initial increase in the target range.
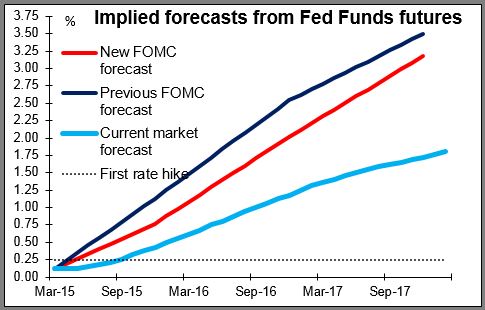
In other words, the FOMC removed its forward guidance that depends on the date and replaced it with guidance that depends on the data. At the same time, they lowered their economic forecasts significantly, including the all-important “dot plot” of the FOMC members’ estimates for the Fed funds rate. The median estimate for Fed funds for 2015 fell by 50 bps to 0.625%, 2016 fell 63 bps to 1.875% and 2017 fell 50 bps to 3.125%. In other words, two rate hikes were taken out, reducing the estimated pace of normalization notably. Moreover, the dots are more closely clustered than they were before, indicating more of a consensus on policy among the FOMC members than before.
The other significant change was a reduction in the estimate of the longer-term unemployment rate to 5.0%-5.2% from 5.2%-5.5%. This is in effect a reduction in their estimate of “maximum employment” as stipulated in their mandate. By lowering this, they in effect said that they can hold off raising rates for longer than they previously thought, because it will take longer to achieve their goal of “maximum employment.” Coupled with a reduction in their estimate of inflation for this year, it means significantly less pressure to raise rates. Fed Chair Yellen said, “Just because we removed the word “patient” doesn’t mean we’re going to be impatient.” I now expect that they will not hike until the September meeting at the earliest.
The only other significant change to the statement was the line, “export growth has weakened.” This was the only allusion to the dollar, implying that it is not yet a major concern for the Fed.
Does this change my view on the dollar? Not at all! Given the huge net long USD/short currency positions built up in the market (as I mentioned on Tuesday with regards to the Commitment of Traders report), it’s no surprise than when the Fed pushes back its estimate for the pace of tightening, people take some profits. But the fundamental facts remain: the Fed is on track to tighten policy while the rest of the world is still in a loosening mode (e.g., Sweden yesterday). While the pace of tightening was slowed, the end point (the FOMC’s estimate of the “longer run” Fed funds rate) was more or less unchanged. Moreover, with US yields still maintaining a healthy spread over euro rates, I still expect the flood of liquidity out of the Eurozone into the US. USD should still appreciate, in my view, just not at the same extraordinary pace we’ve seen recently.
SNB likely to tread carefully The Swiss National Bank (SNB) meets today. It’s likely to tread carefully to avoid saying anything that could strengthen the CHF. CHF has risen against all its G10 counterparts this year, with the exception of the surging dollar. At the same time, the country’s deflation rate of -0.8% is the lowest in the G10 and on par with that of some of the crisis countries, such as Spain (-1.2%) and Greece (-1.8%). Some people would argue that with Swiss prices totally out of line with prices elsewhere in the world (note the Big Mac in Geneva at CHF 11.70), deflation is absolutely the correct policy for the country, but that is a hard argument for a central bank to swallow. CHF interest rates are already significantly negative: 3m CHF LIBOR is -0.81%, in the middle of the SNB’s target range of -1.25% to -0.25%, and the CHF LIBOR futures forecast that rates will stay at that level for the rest of the year and only move slowly back to the bottom of that range by March 2018. I expect that after the trauma of the January CHF unpegging, they will do their best not to rile the markets while also trying to avoid doing or saying anything that might strengthen the already overvalued CHF. They are likely to adjust both their growth and inflation forecasts lower and mention the possibility of cutting rates further into negative territory if necessary, but I expect that they will reaffirm the LIBOR target at the current range and the negative deposit rate at -0.75%. The absence of any further easing measures could cause CHF to firm up a bit.
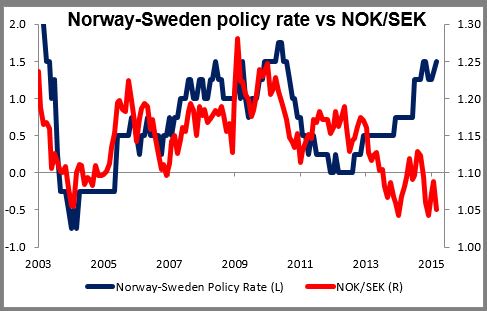
Norges Bank likely to cut The Norges Bank, on the other hand, is likely to cut rates, in my view (and the view of all but one of the 19 economists polled by Bloomberg). This was likely even before Sweden unexpectedly cut its rates yesterday, but after that move, it’s almost a sure thing – as certain as the EUR/CHF floor (that was a joke). Indeed, the Swedish move might even convince the Norwegians to move by more than the expected 25 bps. The country needs to prevent further appreciation of the NOK as it grapples with the effects of a plunge in the price of oil and the accompanying slowdown in its oil industry. When it cut rates in December, Norges Bank said that the depreciation of the NOK “is helping to dampen the effects (of lower oil prices) on the Norwegian economy and underpin inflation,” so they would clearly welcome it. NOK/SEK is far lower than the difference between the two countries’ policy rates would suggest. That implies either NOK has to strengthen considerably relative to SEK – highly unlikely -- or that Norwegian rates have plenty of room to come down. The reaction in the FX market could be to sell NOK if Norges Bank reinforces its dovish view.
Today’s highlights: In addition to the two central bank meetings, the ECB allots its third Targeted Longer-Term Refinancing Operation (TLTRO). The first two allotments were disappointing. Banks took up only around EUR 200bn compared to EUR 400bn that ECB President Mario Draghi hinted at. This was another reason the Bank introduced its QE program in January as it was becoming clear that the liquidity injected into the system was falling below official expectations. The difficulties that the ECB is having in meeting its target for buying bonds suggests that banks do not need more cash, so we do not expect this TLTRO to be particularly successful.
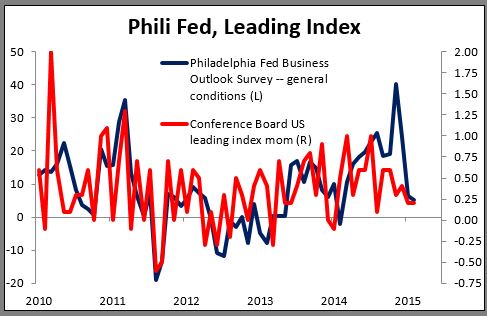
In the US, initial jobless claims for the week ended Mar.14 are expected to rise a bit but the overall trend is expected to remain consistent with an improving labor market. The Philadelphia Fed business activity index for March is forecast to increase a bit, while Conference Board leading index for February is expected to remain unchanged in pace from the previous month.
As for the speakers, besides Norges Bank Governor Oeystein Olsen’s press conference following the rate decision, Riksbank Deputy Governor Cecilia Skingsley and Fed Governor Daniel Tarullo speak.
The Market
EUR/USD surges after the FOMC decision
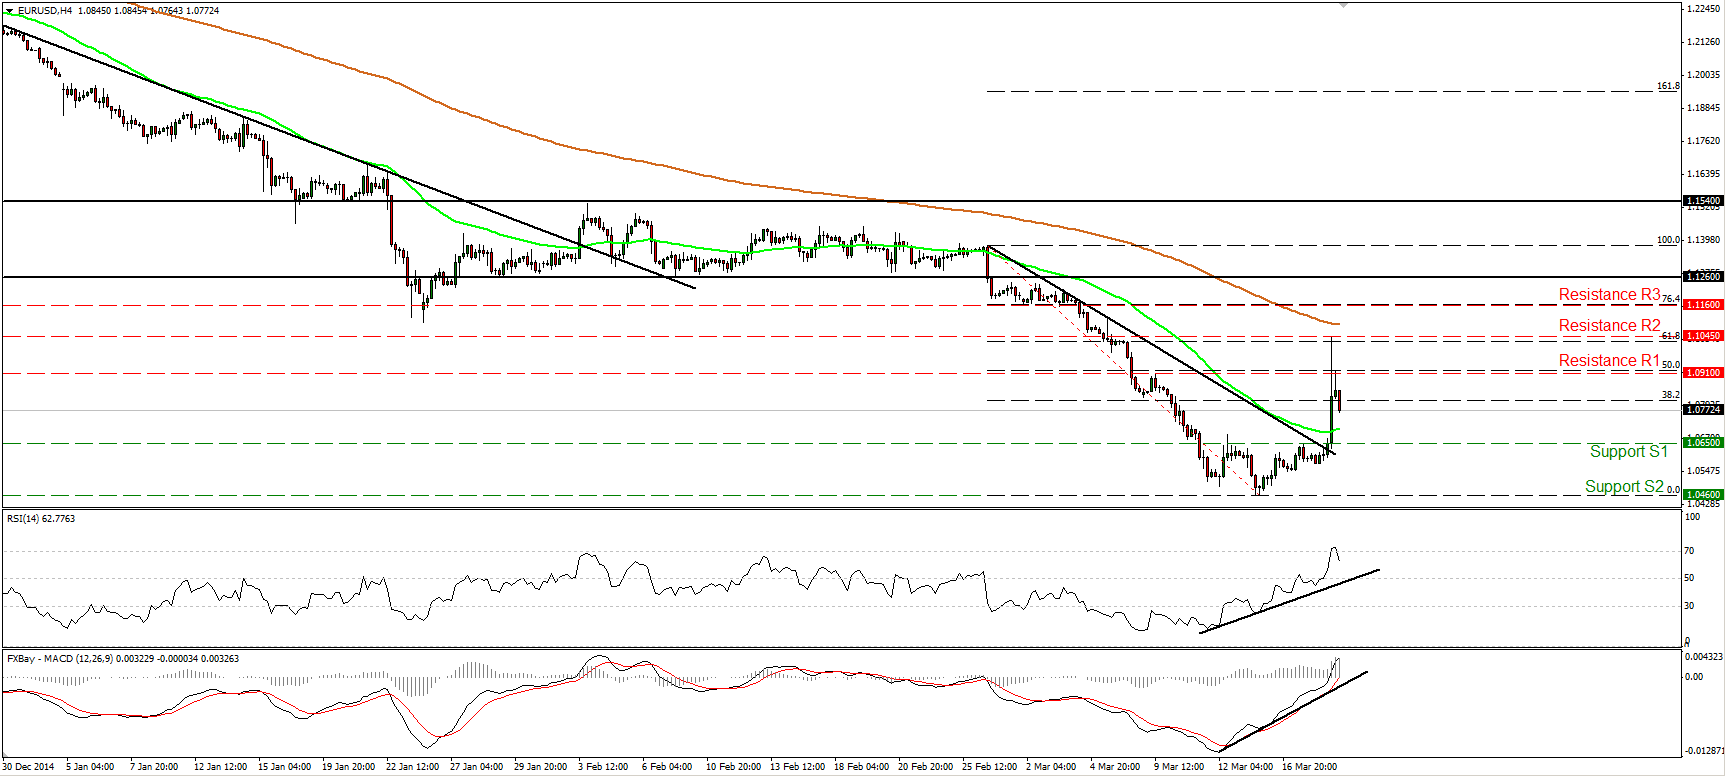
EUR/USD flew approximately 400 pips higher after the Fed, despite dropping “patient”, lowered its interest rate trajectory and downgraded its view on economic growth and inflation. EUR/USD moved above the near-term downtrend line taken from back the peak of the 26th of February to hit resistance at 1.1045 (R2), close to the 61.8% retracement level of the 26th of February – 13th of March decline. Subsequently the pair retreated to trade below 1.08000. My humble opinion is that, although an astonishing rally, it is far from a trend reversal signal. Therefore I would treat yesterday’s move as a corrective phase of the larger downtrend. I believe that the retreat from the highs will continue today as well and that we are likely to experience a test of the 1.0650 (S1) barrier soon. A break below that hurdle could aim for another test at 1.0460 (S2). Our momentum studies support the notion as well. The RSI exited its overbought zone and is pointing down, while the MACD, although turning positive, shows signs that it could start topping.
• Support: 1.0650 (S1), 1.0460 (S2), 1.0360 (S3).
• Resistance: 1.0910 (R1), 1.1045 (R2), 1.1160 (R3).
GBP/USD rallies on Fed’s view as well
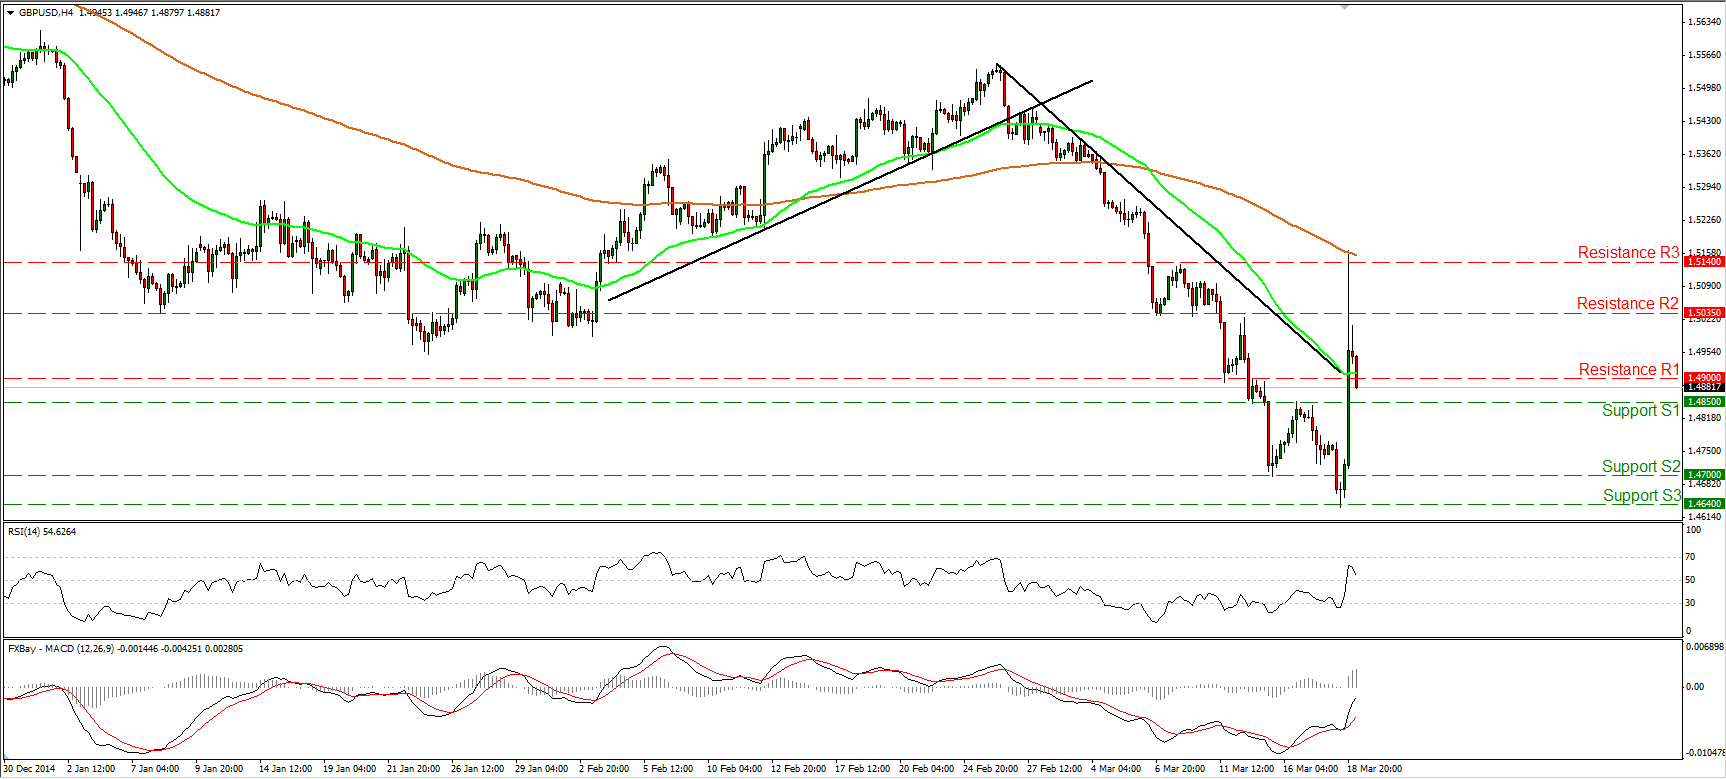
GBP/USD rocketed higher on Wednesday following the stance of the FOMC members and hit resistance at 1.5165, near the 200-period moving average. After the surge, Cable gave back a noteworthy amount of its gains and is currently trading back below the 1.4900 (R1) level. Here as well, I believe that yesterday’s move was just a corrective move and that the greenback is likely to regain its glamour very soon. A clear break below the 1.4850 (S1) support line is likely to confirm my view and could see scope for larger bearish extensions, perhaps towards our next support at 1.4700 (S2). As for the broader trend, the absence of any bullish reversal signals supports my view to treat yesterday’s move as a correction. The overall path is still to the downside, from my perspective.
• Support: 1.4850 (S1), 1.4700 (S2), 1.4640 (S3).
• Resistance: 1.4900 (R1), 1.5035 (R2), 1.5140 (R3).
EUR/JPY hits resistance near 131.85
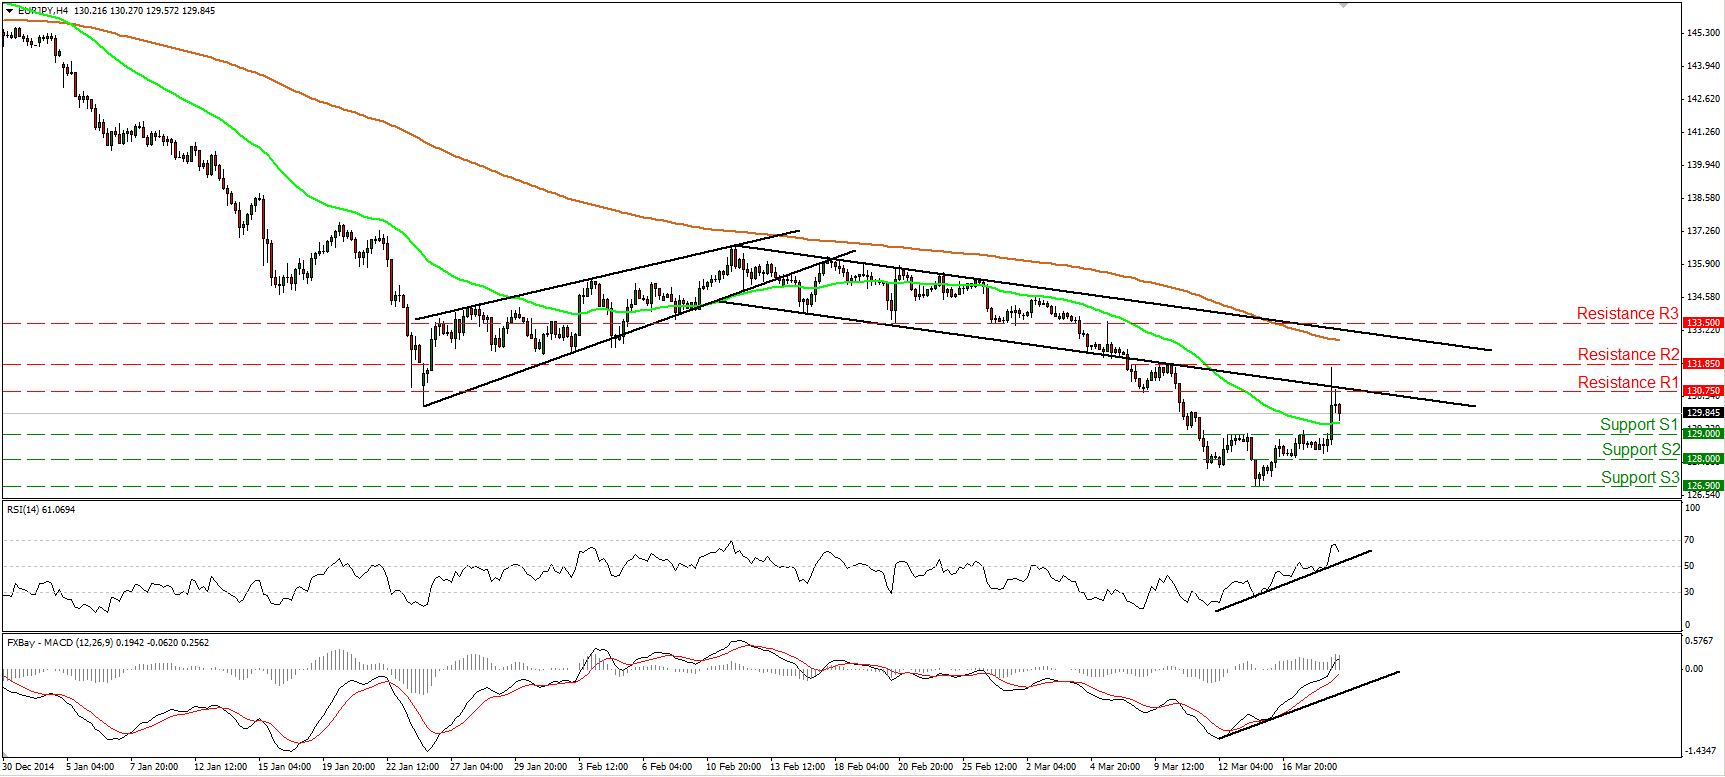
EUR/JPY raced higher on Wednesday, but the advance was halted near the 131.85 (R2) resistance hurdle. The pair entered within the prior downside channel for a while, but retreated to trade below its lower boundary again. Consequently, I would expect the forthcoming wave to be negative and challenge the 129.00 (S1) hurdle. A move below that bar could extend the bearish move, perhaps towards 128.00 (S2). On the daily chart, I still see a longer-term downtrend. I would see the recovery from 126.90 (S3) as a retracement of that larger down path. Nevertheless, there is positive divergence between our daily oscillators and the price action. This gives me a reason to take the side lines as far as the overall trend is concerned. I would like to wait for momentum and price action alignment.
• Support: 129.00 (S1), 128.00 (S2), 126.90 (S3).
• Resistance: 130.75 (R1), 131.85 (R2), 133.50 (R3).
Gold firms higher after Fed’s dovish tone
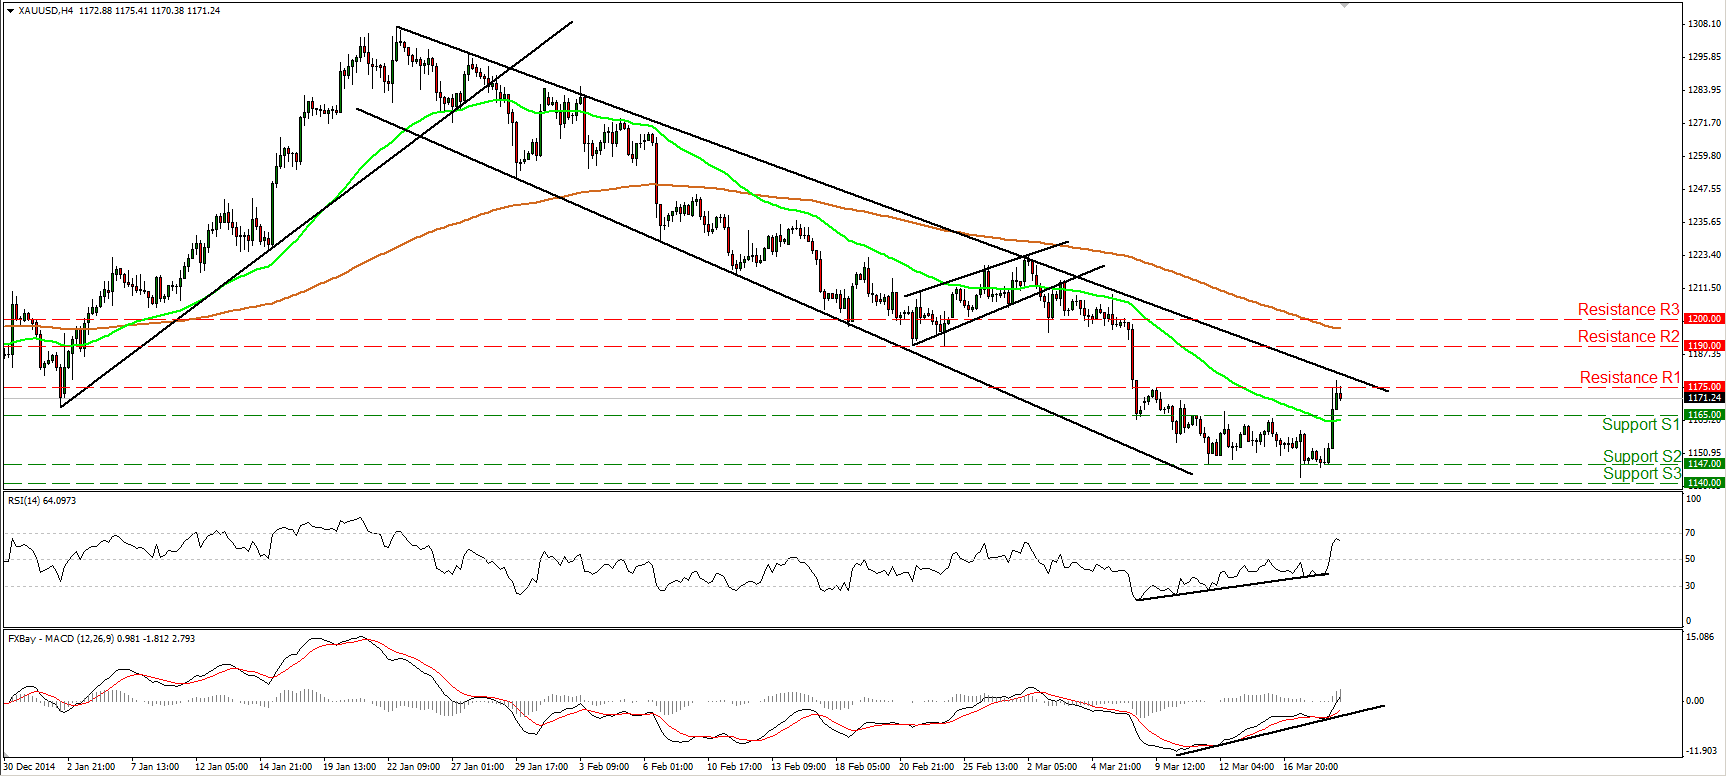
Gold shot up yesterday following the more-dovish-than-anticipated tone of the Fed, and hit resistance near our 1175 (R1) hurdle. Nevertheless, the precious metal is still trading below the downtrend line taken from back at the high of the 22nd of January, therefore I still consider the outlook to be negative. A move below the support line of 1165 (S1) would probably confirm that the bears are back in the game and perhaps pull the trigger for another test at the 1147 (S2) line. As for the broader trend, the decline from 1307 seem to be in force from a technical standpoint, but only a move below 1140 (S3) would signal a forthcoming lower low on the daily chart and probably the continuation of that down path.
• Support: 1165 (S1), 1147 (S2), 1140 (S3).
• Resistance: 1175 (R1), 1190 (R2), 1200 (R3).
WTI higher due to the weaker dollar
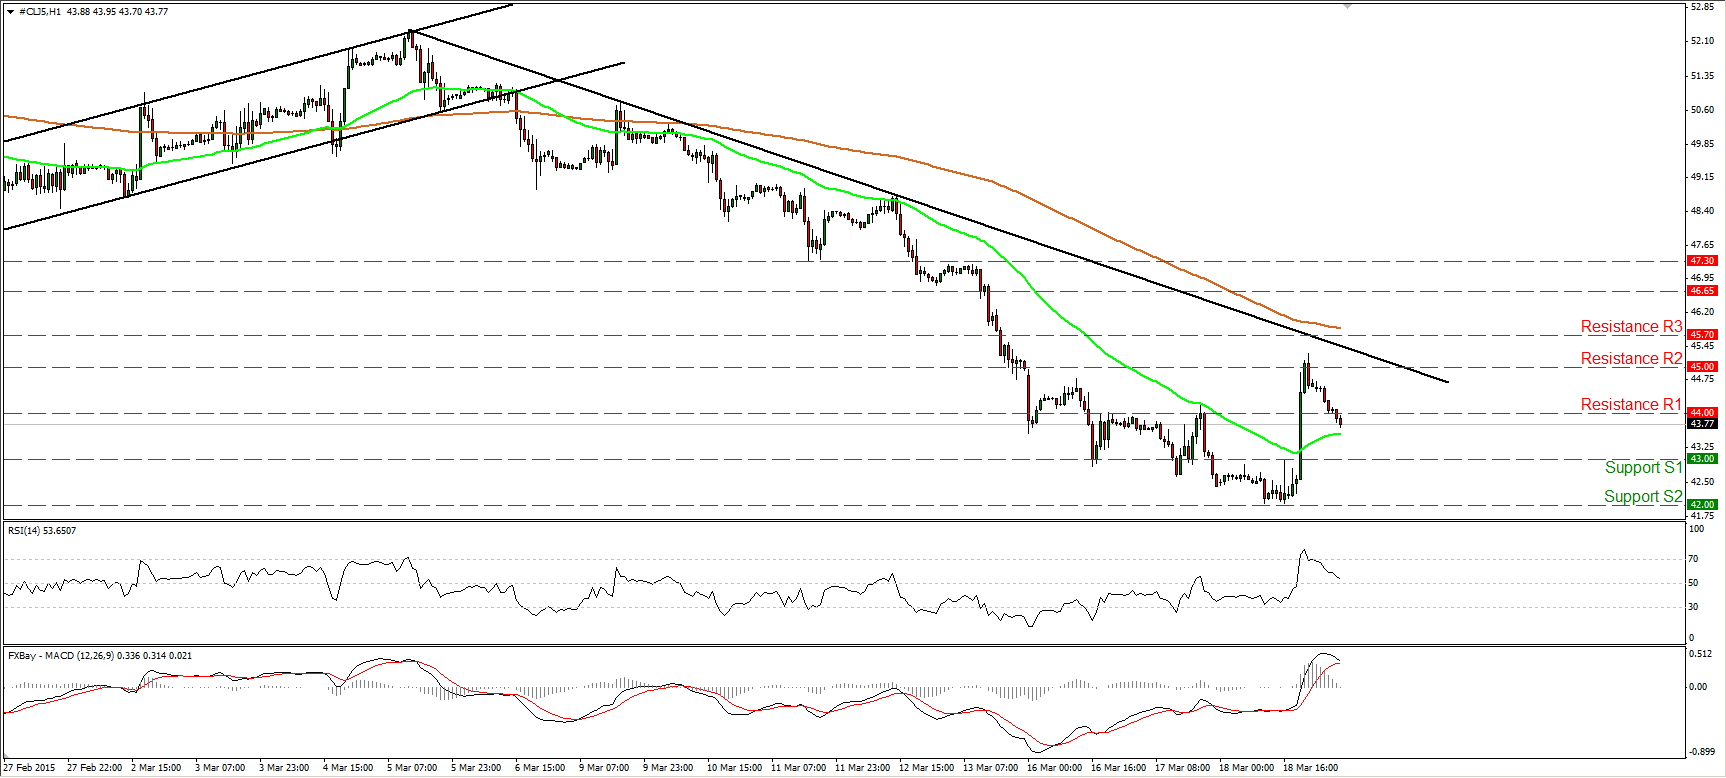
WTI rallied on Wednesday as well, but found resistance slightly above the 45.00 (R2) barrier, and remained below the downtrend line drawn from the peak of the 5th of March. After hitting resistance near 45.00 (R2), WTI took the down road and during the early European morning is trading back below 44.00 (R1). Having in mind that the price remained below the aforementioned trend line, I would expect the current down wave to continue and test the 43.00 (S1) line. A clear move below that level is likely to set the stage for another test at the 42.00 (S2) obstacle, marked by the low of the 11th of March 2009. Our short-term oscillators amplify the case that the decline may continue. The RSI exited its overbought territory and is now approaching its 50 line, while the MACD has topped and appears ready to fall below its trigger line. On the daily chart, WTI is printing lower peaks and lower troughs below both the 50- and the 200-day moving averages. This keeps the longer-term downtrend intact in my view.
• Support: 43.00 (S1), 42.00 (S2), 40.00 (S3).
• Resistance: 44.00 (R1) 45.00 (R2), 45.70 (R3) .

