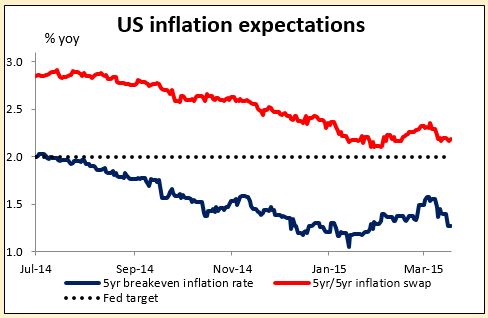
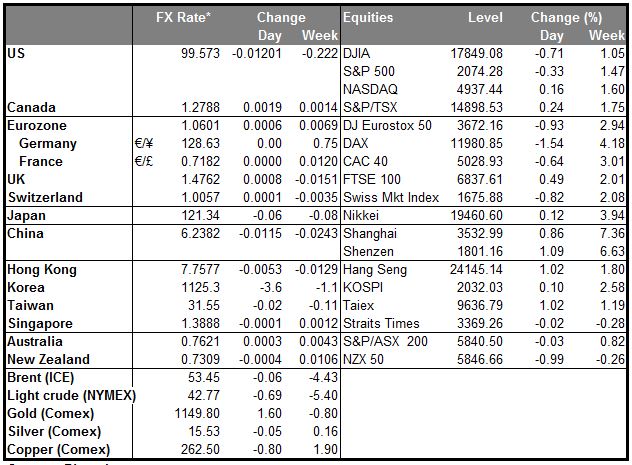
Last words about the FOMC meeting: As I said before, I still expect the FOMC to remove the reference to “patient” in the statement, not necessarily because they want to raise rates immediately but rather because they want to have the option to raise rates. Removing that term will allow them to raise rates if the data warrant it. So far, the data don’t necessarily warrant it. While the employment situation is improving nicely, wage growth remains tepid. The recent plunge in oil prices suggests inflation might turn down again, and inflation expectations have started falling in anticipation. The Atlanta Fed’s “GDPNow” forecast of Q1 GDP is a mere +0.3% qoq SAAR, although how much of this is due to the bad weather and US port strikes and how much to underlying economic weakness is open to question. Fed funds rate expectations have fallen by up to 17 bps since the last US payroll data. So there is clearly no rush to raise rates. However, it appears that Chair Yellen and her colleagues would like the decision to be dictated by the data, not by their views, and so want to cut themselves free of the “forward guidance” that they themselves put into place in order to convince the market that they were serious about keeping rates low. This view is probably consensus by now, so if they do not remove the line, then USD is likely to fall sharply.
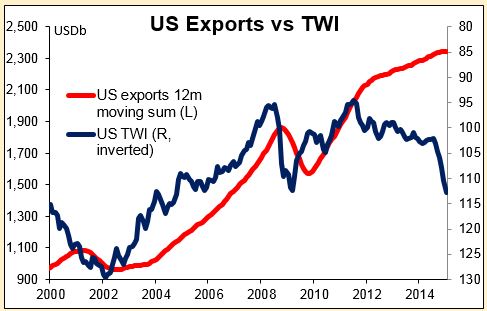
Will the statement mention the dollar? The dollar was not a big topic of discussion at the January meeting. It didn’t make it into the statement following the meeting; there was only a vague mention of “international developments,” which might have referred to the Greek elections as much as the dollar. Looking at the minutes, the members though it would be “a persistent source of restraint on U.S. net exports, and a few participants pointed to the risk that the dollar could appreciate further.” However, US exports are only 13% of GDP and net exports 2.8%, which may be significant enough to warrant some discussion but not a determining factor in setting policy. While the huge companies in the S & P 500 make a lot of noise about the dollar, it’s not a big concern for the average pizza parlor or barber shop. Some participants also noted that a stronger dollar would offset the impact of lower real interest rates to some degree. This phenomenon could lead to a slower pace of growth in tightening but would not be likely to veto it entirely.
Yellen is not likely to say anything about the dollar’s value or “currency wars” The dollar is the concern of the Treasury, not the Fed, and Fed officials rarely if ever comment on it. If she is asked about the “currency wars,” Yellen is likely to dismiss the idea, saying that weaker foreign currencies are simply a spillover from valid monetary policies taken to support domestic demand in other countries. Insofar as these policies help to revive global growth, they are good for the US too. She can hardly say otherwise, given that the Fed ran such a massive QE program for so long.
Look for more volatility FOMC days tend to be more volatile than the average day, and FOMC days with a press conference tend to be more volatile than FOMC days without one. Get ready for some big moves!
Big move in gold: The gold prices was falling sharply in the late European afternoon despite the weaker dollar – a bad sign for the precious metal -- when all of a sudden it went shooting up on a huge buying order. That may have been related to a headline from Eurogroup Chairman Jeroen Dijsselbloem that “Capital Controls Could Prevent Greek Euro Exit.” The story mentioned the Cyprus bank holiday and capital controls as a template for what can be done to keep a country in the Eurozone. The Greek government was not amused; a spokesman called this a “fantasy scenario” and reprimanded him for overstepping his institutional role. It was notable though that gold quickly lost most of its gains, which suggests that the safe haven bid for gold is just not there anymore.
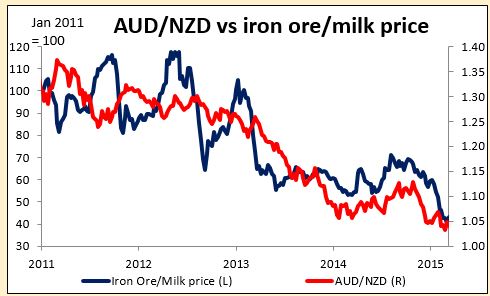
NZD the big loser as milk prices fall: The NZD was the biggest loser against the dollar among the G10 currencies over the last 24 hours after the average price for milk at yesterday’s auction fell to USD 3136.10 from USD 3374.00. Still, milk prices are doing better than iron ore – they’re up 20% so far this year, while Australia’s iron ore export price to China is down 9.1%. The Australian government overnight cut its outlook for iron ore prices from its December forecast due to weak Chinese demand meeting increased supply. This is causing them to trim their budget forecast, which means a slightly tighter fiscal policy. I still prefer NZD to AUD. This could be a good opportunity to short AUD/NZD.
Today’s highlights During the European day, we get eurozone’s trade balance for January.
Wednesday is a big day for the UK. The unemployment rate for January and Bank of England March meeting minutes will be announced. Unemployment is expected to fall and weekly earnings accelerate somewhat, which in theory should put upward pressure on sterling, but the currency seems to be dominated more by political concerns, plus comments from officials. In that respect, the minutes may be more important. We don’t expect to learn much more beyond what BoE Governor Mark Carney said recently about how inflation would return to its 2% target within the next two years and the strength of sterling is a risk for the economy. It could also show that BoE next move on monetary policy will be to raise interest rates, but they might cut them further below their record low level if very low inflation becomes self-reinforcing. Separately, the government will also announce the final budget before the May general election. With the vote too close to call, Chancellor Osborne may introduce new fiscal and spending measures in a bid to persuade voters that five years of austerity are paying off with an improved economic outlook.
On Thursday morning New Zealand time, the Q4 GDP is expected to expand at a slower pace from Q3. This could prove NZD-negative.
As for the speakers, besides Fed Chair Janet Yellen’s post-FOMC press conference, ECB President Mario Draghi, ECB Executive board member Benoit Coeure, and Bank of England Deputy Governor for Financial Stability Jon Cunliffe speak.
The Market
EUR/USD slightly higher ahead of the FOMC decision
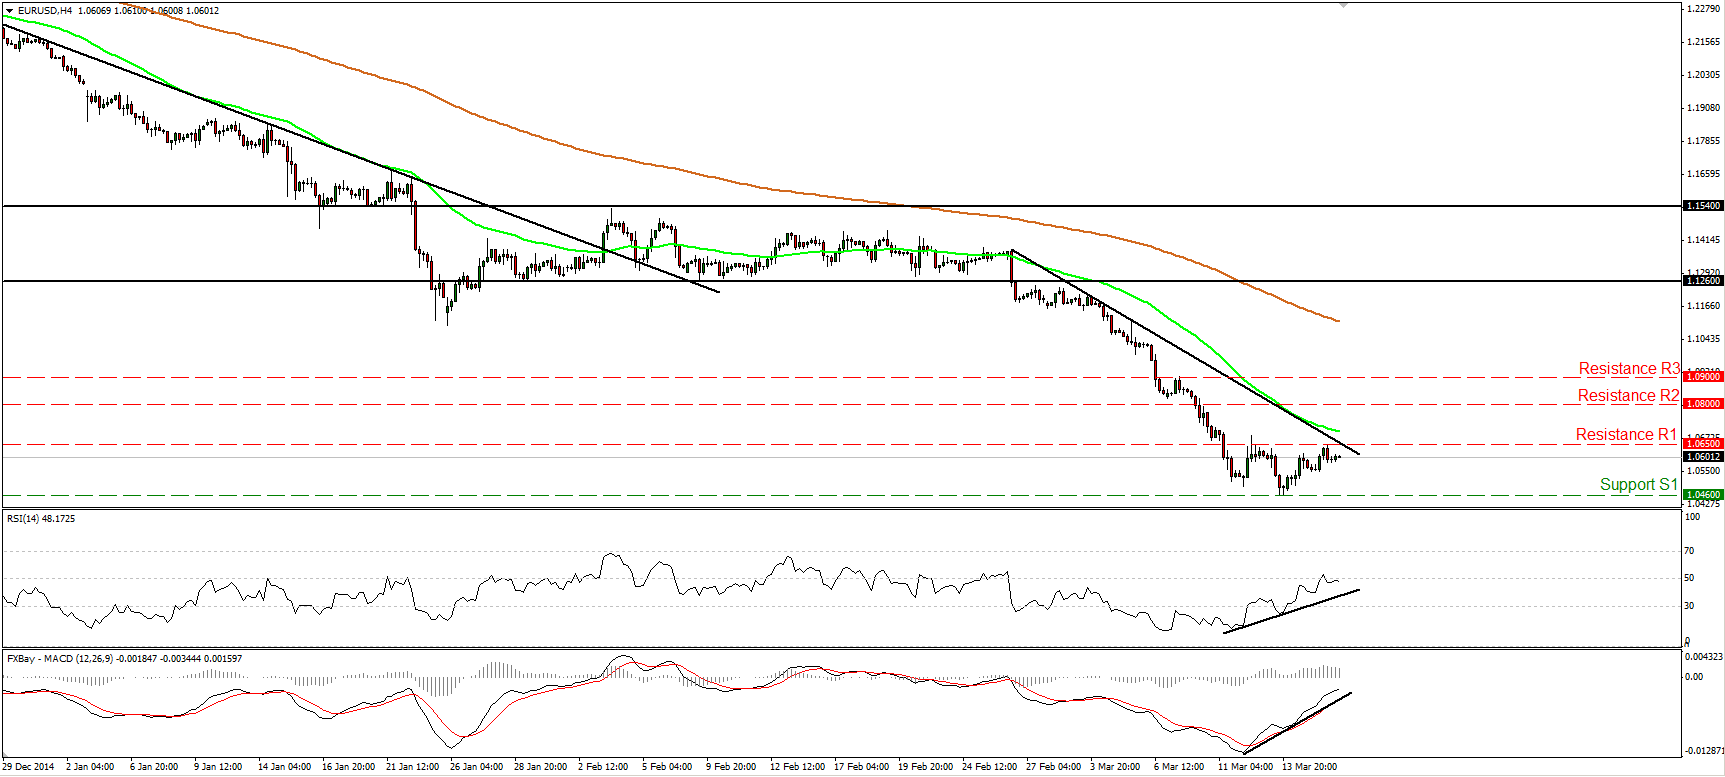
EUR/USD continued to trade higher on Tuesday, but the up leg found resistance at 1.0650 (R1). The rate is now trading slightly below the crossroad between that barrier and the near-term downtrend line taken from back the peak of the 26th of February. The bears may take the reins at that point and drive the rate down for another test of 1.0460 (S1), the low of the 13th of March. Today the Fed ends its two day policy meeting. Market attention is focused on whether officials will remove the word “patient” from their statement, which would give them the flexibility to start raising rates as early as in June. This could be the trigger for the aforementioned down leg and the test or even the break of the 1.0460 (S1) hurdle. A possible dip would open the way for the 1.0360 (S2) barrier, defined by the low of the 8th of January 2003. With regards to the broader trend, I believe that the pair is still in a downtrend. EUR/USD is printing lower peaks and lower troughs below both the 50- and the 200-day moving averages.
• Support: 1.0460 (S1), 1.0360 (S2), 1.0185 (S3).
• Resistance: 1.0650 (R1), 1.0800 (R2), 1.0900 (R3).
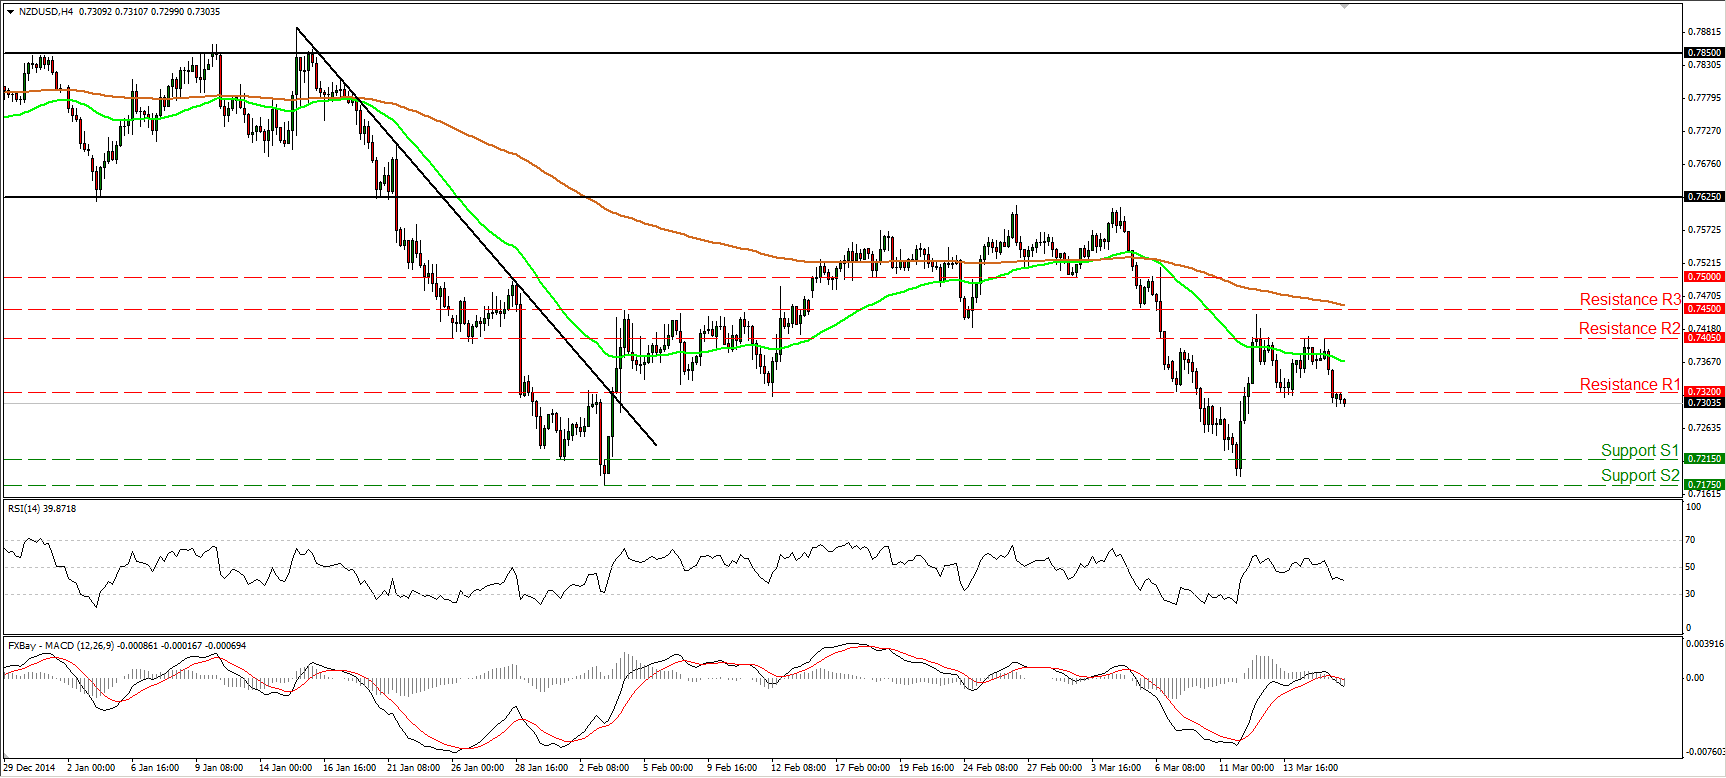
NZD/USD breaks below 0.7320
NZD/USD tumbled on Tuesday and managed to move below the support (now turned into resistance) hurdle of 0.7320 (R1). The break confirmed a forthcoming lower low on the 4-hour chart and in my view, it could pave the way for a test near the 0.7215 (S1) hurdle. Our short-term oscillators detect negative momentum and magnify the case for further downside extensions. The RSI moved lower after breaking below its 50 line, while the MACD has topped slightly above zero, turned negative and crossed below its trigger. In the bigger picture, the plunge from near 0.7625 confirmed my view that the recovery from 0.7175 (S2) was just a corrective phase of the larger downtrend. Nevertheless, I would like to see a move below 0.7000 (S3) before getting more confident on that larger path. The reason is that the lows of the 3rd of February and the 11th of March are at about the same level, which could evolve as a double bottom pattern. Moreover, I see positive divergence between the daily momentum studies and the price action.
• Support: 0.7215 (S1), 0.7175 (S2), 0.7000 (S3).
• Resistance: 0.7320 (R1), 0.7405 (R2), 0.7450 (R3).
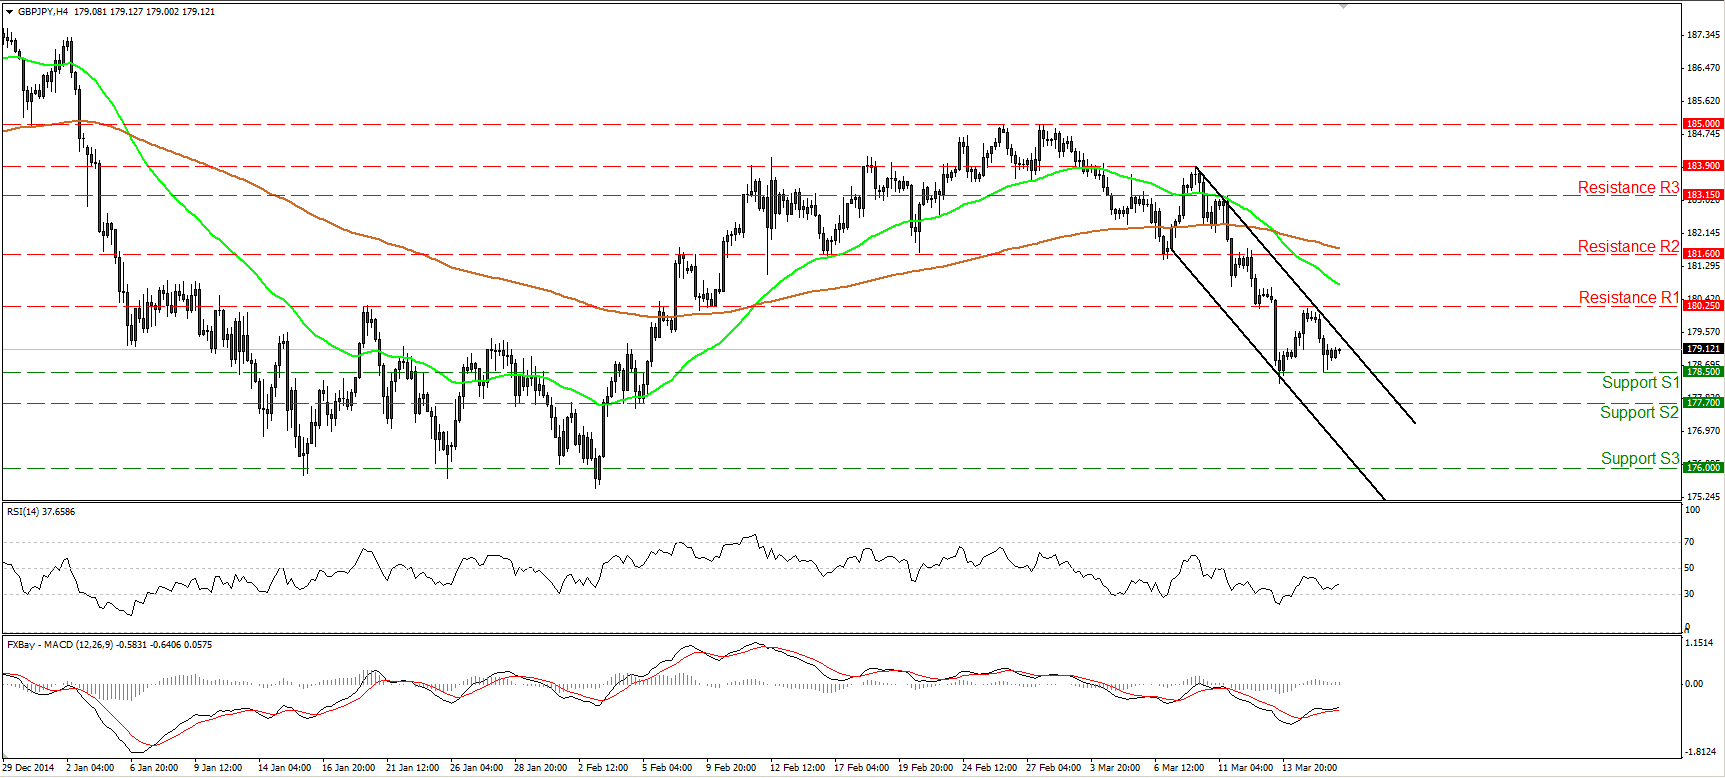
GBP/JPY trades within a near-term downside channel
GBP/JPY tumbled yesterday after finding resistance at 180.25 (R1), and hit support at 178.50 (S1). The rate is trading below both the 50- and the 200-period moving averages, within a downside black channel and this keeps the near-term outlook negative. A break below 178.50 (S1) would confirm a forthcoming lower low and perhaps challenge the 177.70 (S2) line. Nevertheless, today we have several events from the UK that could distort the technical picture of this pair. The UK employment data are expected to come positive, which is supportive for the pound, but the minutes of the latest BoE meeting could reinforce what governor Carney said recently, that the strength of sterling is a risk for the economy, a comment which is negative for GBP. Plus there’s the wild card of the UK Budget. On the daily chart, GBP/JPY has moved well below the 50-day moving average, but is getting closer to the 200-day one, which provided reliable support to the price action back in January. This is another reason I prefer to take the sidelines today and wait for clearer directional signals.
• Support: 178.50 (S1), 177.70 (S2), 176.00 (S3).
• Resistance: 180.25 (R1), 181.60 (R2), 183.15 (R3).
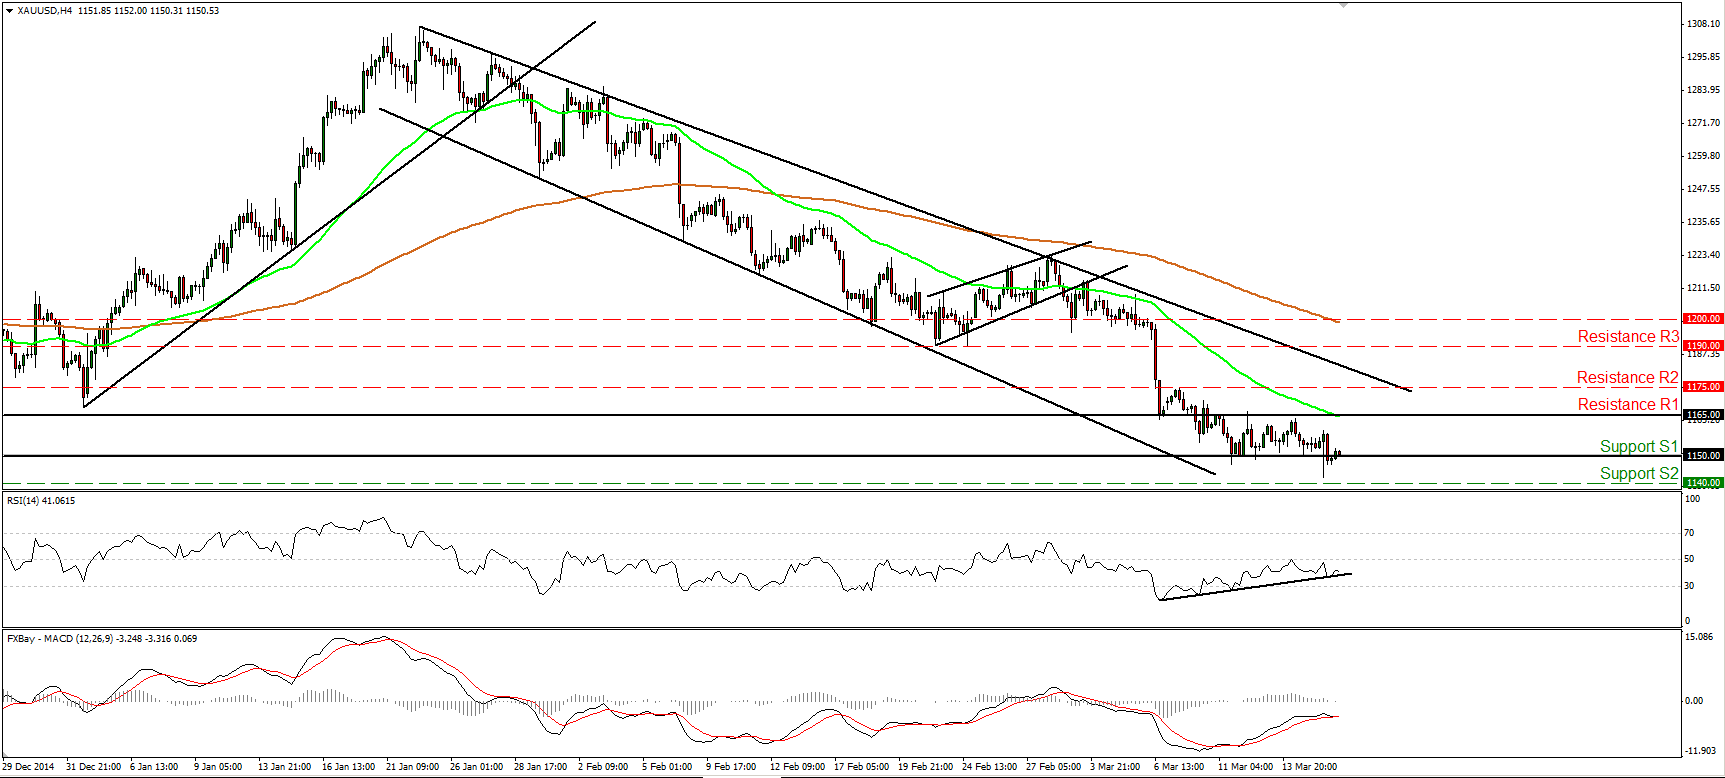
Gold finds support marginally above 1140
Gold traded lower on Tuesday, but hit support two dollars above the 1140 (S2) hurdle and rebounded to trade back above 1150 (S1). The FOMC statement today could prove the catalyst for another test near the 1140 (S2) barrier, and if the bears are strong enough to overcome it, I would expect them to set the stage for extensions towards our next support at 1130 (S3). Taking into account that the precious metal is still trading below both the 50- and the 200-period moving averages, and below the downtrend line taken from back at the high of the 22nd of January, I still consider the outlook to be negative. Our oscillators support the case for further declines as well. The RSI hit resistance at its 50 line, moved lower, and now appears ready to break its upside support line, while the MACD, already negative, touched its toe below its trigger line.
• Support: 1150 (S1), 1140 (S2), 1130 (S3).
• Resistance: 1165 (R1), 1175 (R2), 1190 (R3).
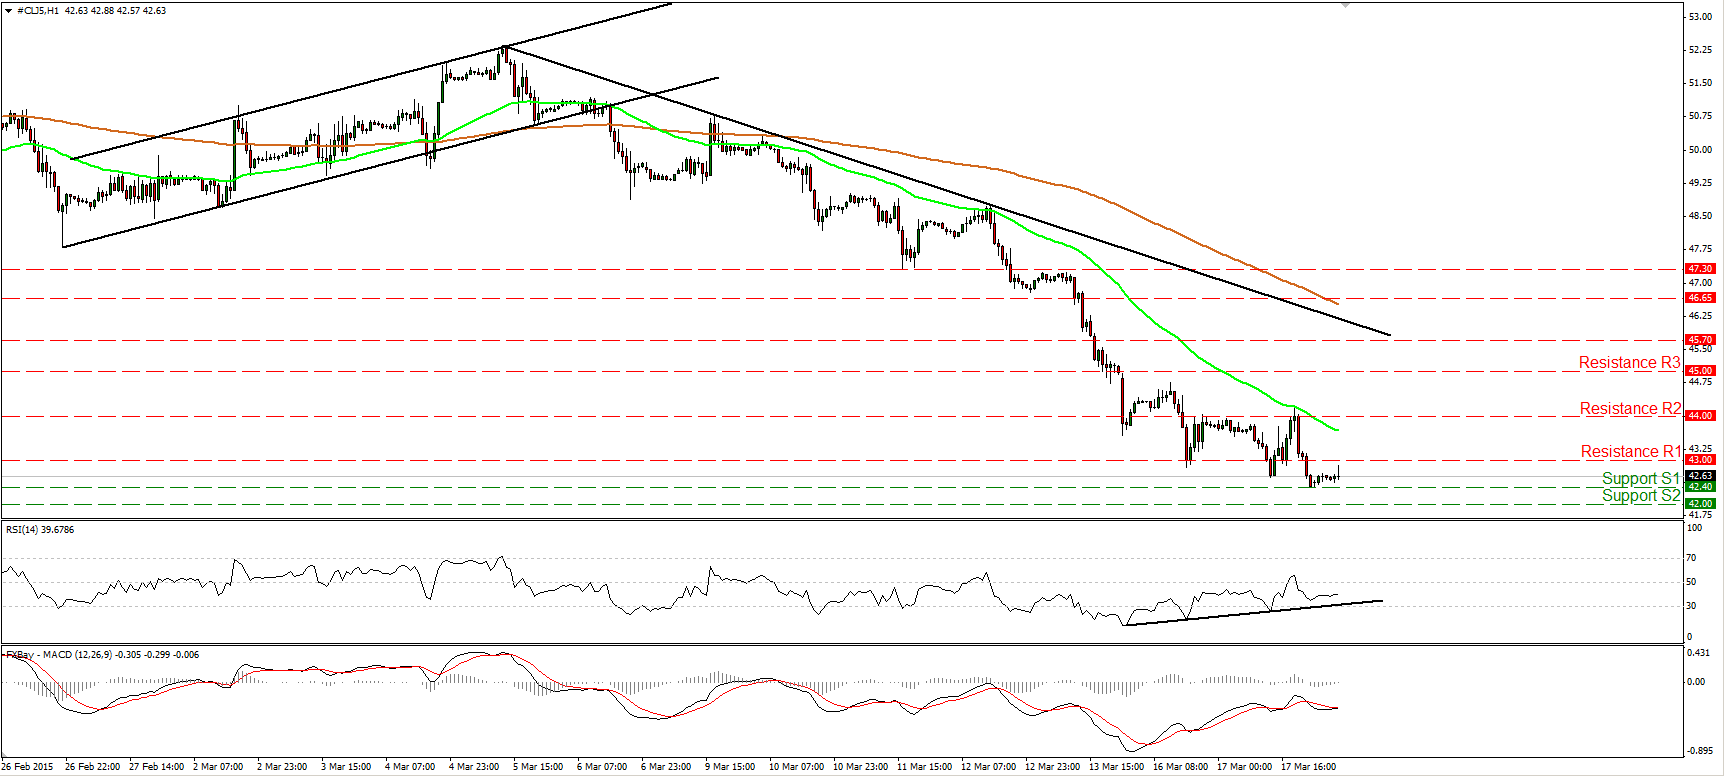
WTI continues the downtrend
WTI hit resistance near the 44.00 (R2) barrier and tumbled to trade below the 43.00 (R1) level. The price found support at 42.40 (S1), but I still expect a test of the 42.00 (S2) line, marked by the low of the 11th of March 2009. The near-term path remains negative and I would expect a move below 42.00 (S2) to set the stage for larger downside extensions towards the psychological zone of 40.00 (S3). However, at the moment I would be careful that an upside corrective move could be looming before sellers seize control again. This is because I see positive divergence between the RSI and the price action. Moreover, the MACD looks ready to cross above its signal line. On the daily chart, WTI is still trading below both the 50- and the 200-day moving averages. Meanwhile, the 14-day RSI just crossed below its 30 line, while the MACD moved deeper into its negative field. This keeps the longer-term bias to the downside, in my opinion.
• Support: 42.40 (S1), 42.00 (S2), 40.00 (S3).
• Resistance: 43.00 (R1) 44.00 (R2), 45.00 (R3).

