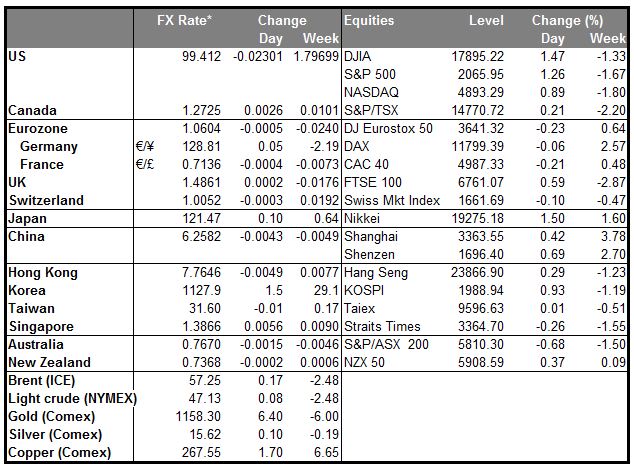
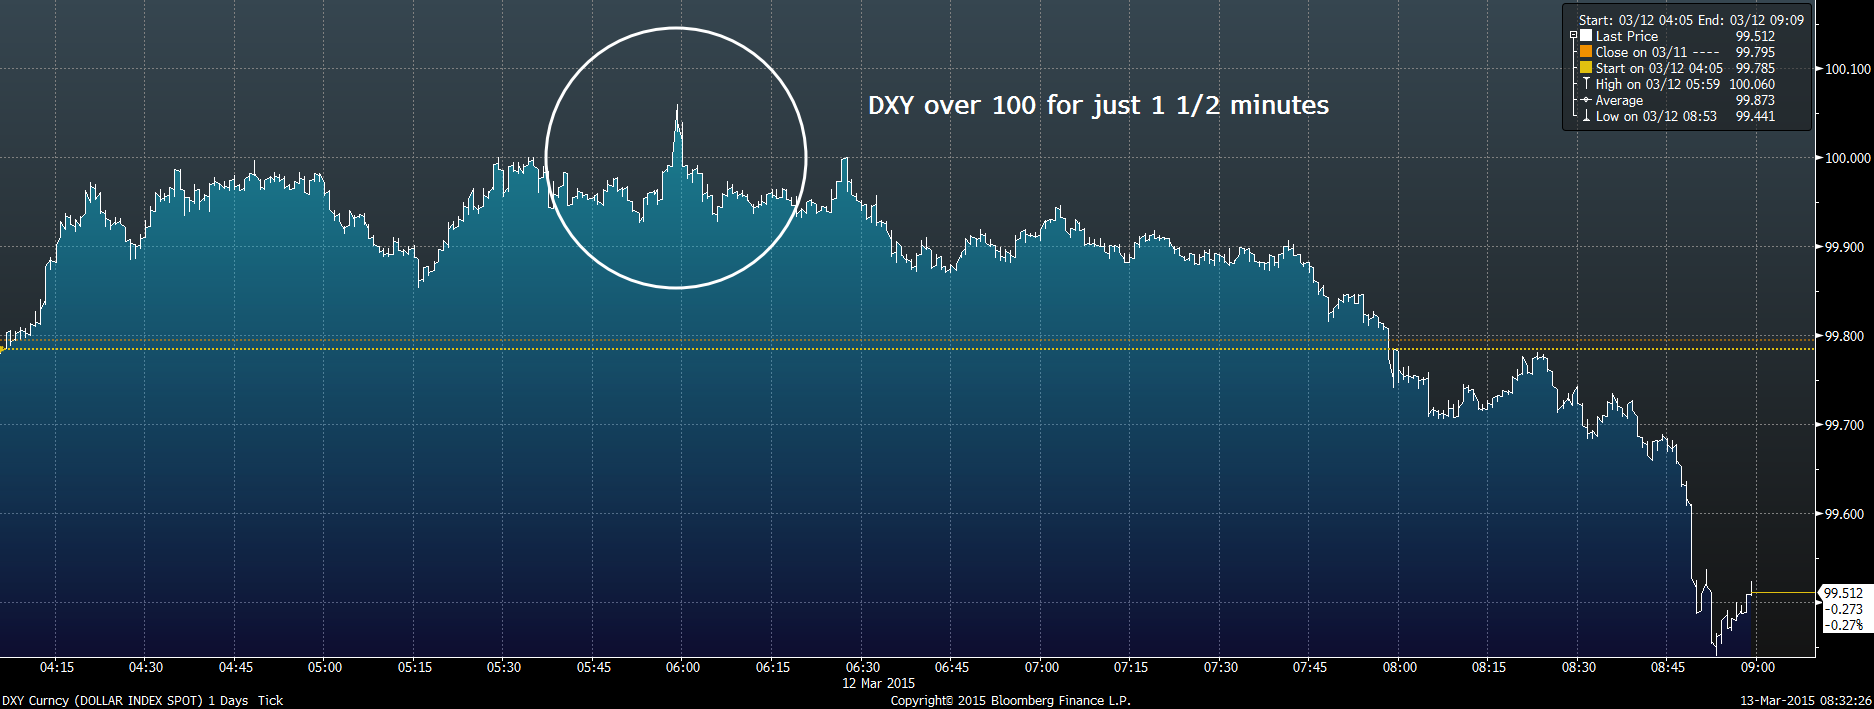
After several frantic days of astonishing moves, the dollar took a breather yesterday. It fell against all the other G10 currencies except the pound and most of the EM currencies that we track as well. The DXY index just poked its nose over 100 for a moment and then that was it (it’s now 99.42 as I write this morning). I doubt if the rally is over, however. A bout of profit-taking after such a rapid move was natural. But there was no fundamental news to cause a reversal in the trend, nor do the technical indicate a reversal (see below), so I don’t think this move is over yet by any means. Rather, the market may just consolidate until next Wednesday’s FOMC meeting, which is likely to provide the next signpost for where the dollar goes. Note though that recently, any consolidations have proved short-lived and ended with EUR/USD breaking out on the downside. So long as German seven-year bond yields are still negative and Portuguese yields are below US yields, the flood of money out of Europe is likely to continue, in my view.
US retail sales weak, but maybe due to weather Yesterday’s US retail sales figure for February was weak, but that may be due to the bad weather. Also, retail sales are reported in nominal terms, not real terms, and so low inflation will naturally depress the rise in sales.
GBP hits new low vs USD
The pound was the only currency to make a new (recent) low against the dollar. Bank of England Gov. Mark Carney yesterday expressed concern about the strength of the pound, saying that its strength was one factor affecting the pace and degree of interest rate increases. Sterling interest rate eased as a result and the pound fell. Nonetheless I feel fairly optimistic about sterling, against EUR if not vs USD, as there is only a limited number of currencies that the outflow of money from Europe seeking higher yields can go into.
Oil falls further; watch for NOK, CAD
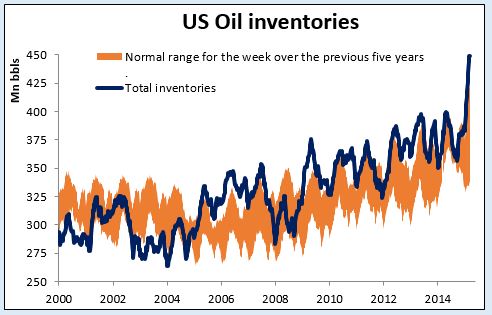
Oil prices fell further, with Brent down about 1% and WTI collapsing 2.1% as US inventories rose to the highest level since weekly data started in 1982. Genscape, a company that monitors US oil inventories, said stocks at the main US oil center of Cushing, Oklahoma rose by 2.2mn barrels in the latest week. Also the Houston Ship Channel, a key conduit for US crude imports, was fully reopened Thursday morning. NOK was the best performing G10 currency over the last 24 hours but the weaker oil prices may weigh on it today. CAD also gained on the day but not so much; weaker US oil prices are bound to pressure it today, along with anticipation of a weak employment report (see below).
Today’s highlights: A relatively light day today. During the European day, the only indicator worth mentioning is the German wholesale price index for February. Although it is not a major market mover, it could add to the recent encouraging German data.
In the absence of any major European indicators, Greek concerns may come to the fore again today. Technical teams representing Greece’s international creditors are meeting with government officials today to discuss the budget ahead of next week’s negotiations on the troubled country’s fiscal targets. PM Tsipras Thursday signed an agreement with the OECD that pledges to pursue reforms in line with the country’s previous commitments, but there still seems to be some disagreement between Greece and the IMF on the tax and spending reforms to be instituted. Tsipras will hold talks with EC President Juncker and European Parliament President Schulz today.
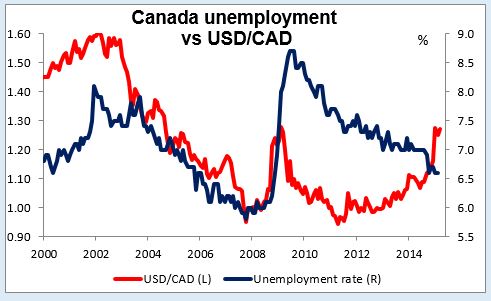
In Canada, the main event will be the employment report for February. The forecast is for the unemployment rate to increase, while the net employment change is expected to show a decline of 5k after a rise of 35.4k in the previous month. Given the negative sentiment towards CAD, this could push USD/CAD higher.
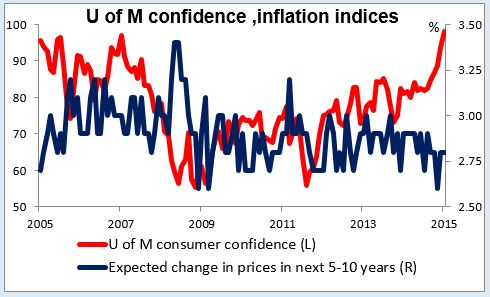
In the US, the preliminary U of M consumer sentiment index for March is expected to increase a bit from the previous month. The surveys of 1-year and 5-to-10 year inflation expectation outlook are also coming out.
As for the speakers, Bank of England Deputy Governor of Markets and Banking Minouche Shafik speaks.
The Market
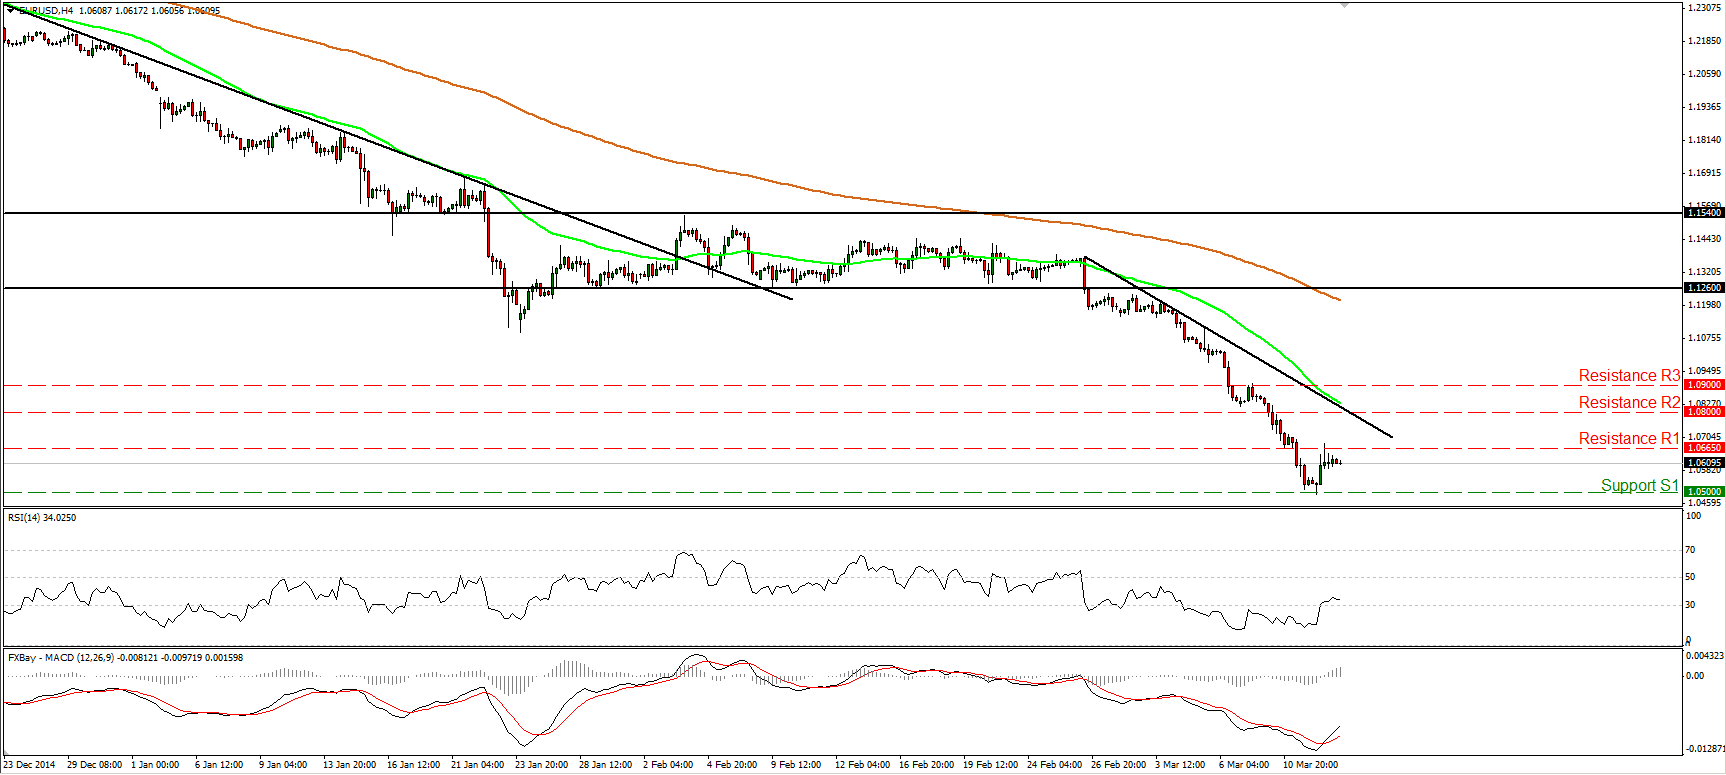
EUR/USD rebounds from 1.0500
EUR/USD raced higher yesterday after triggering some buy orders near the psychological barrier of 1.0500 (S1). Nevertheless the advance was halted near our resistance line of 1.0665 (R1). The short-term outlook stays negative in my view, thus I would expect the bears to eventually take control again and perhaps aim for another test at the 1.0500 (S1) key area. A clear move below 1.0500 (S1) is likely to set the stage for extensions towards 1.0360 (S2), defined by the low of the 8th of January 2003. I would stay cautious though that the rebound may continue a bit more before the next leg down. My worries are derived from our momentum indicators. The RSI exited its oversold territory, while the MACD stands above its trigger pointing up. With regards to the broader trend, I believe that the pair is still in a downtrend. EUR/USD is printing lower peaks and lower troughs below both the 50- and the 200-day moving averages.
• Support: 1.0500 (S1), 1.0360 (S2), 1.0185 (S3).
• Resistance: 1.0665 (R1), 1.0800 (R2), 1.0900 (R3).
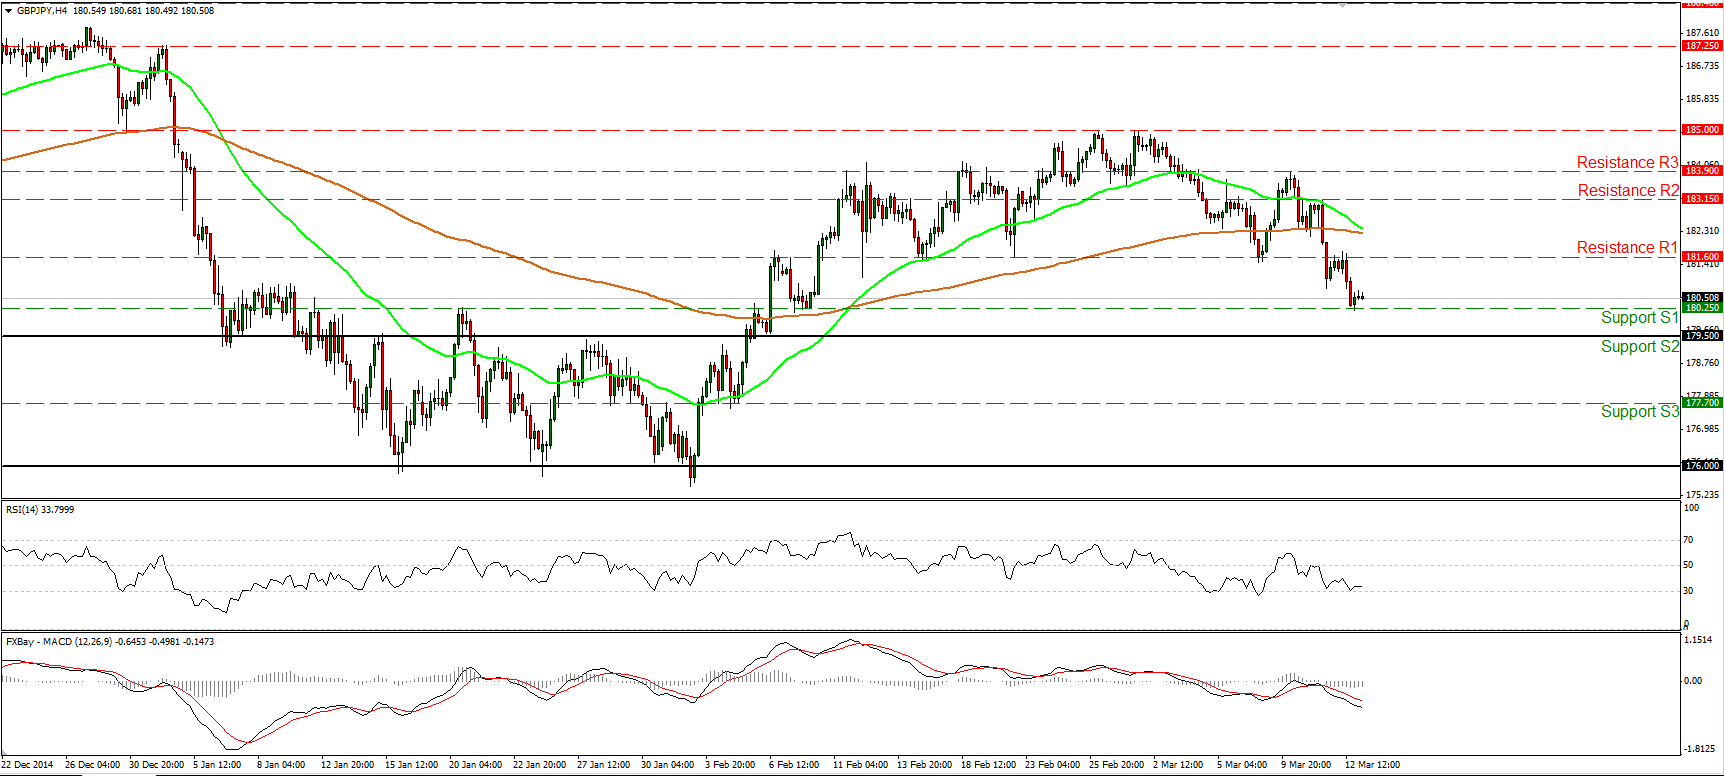
GBP/JPY finds support at 180.25
GBP/JPY tumbled on Thursday, after finding resistance near the 181.60 (R1) hurdle. The pair found support at our 180.25 (S1) line. A break of that is likely to challenge the key barrier of 179.50 (S2). As long as the rate is printing lower highs and lower lows on the 4-hour chart, the near-term picture remains negative in my view. Our short-term momentum studies corroborate my view. The RSI moved lower and hit its 30 line, while the MACD stands below both its zero and signal lines, pointing down. On the daily chart, the rate is trading below the 50-day moving average, but still above the 200-day one. Therefore I would consider the overall picture of this pair to stay cautiously positive and I would see the near-term downtrend as a corrective move of the larger upside path.
• Support: 180.25 (S1), 179.50 (S2), 177.70 (S3).
• Resistance: 181.60 (R1), 183.15 (R2), 183.90 (R3).
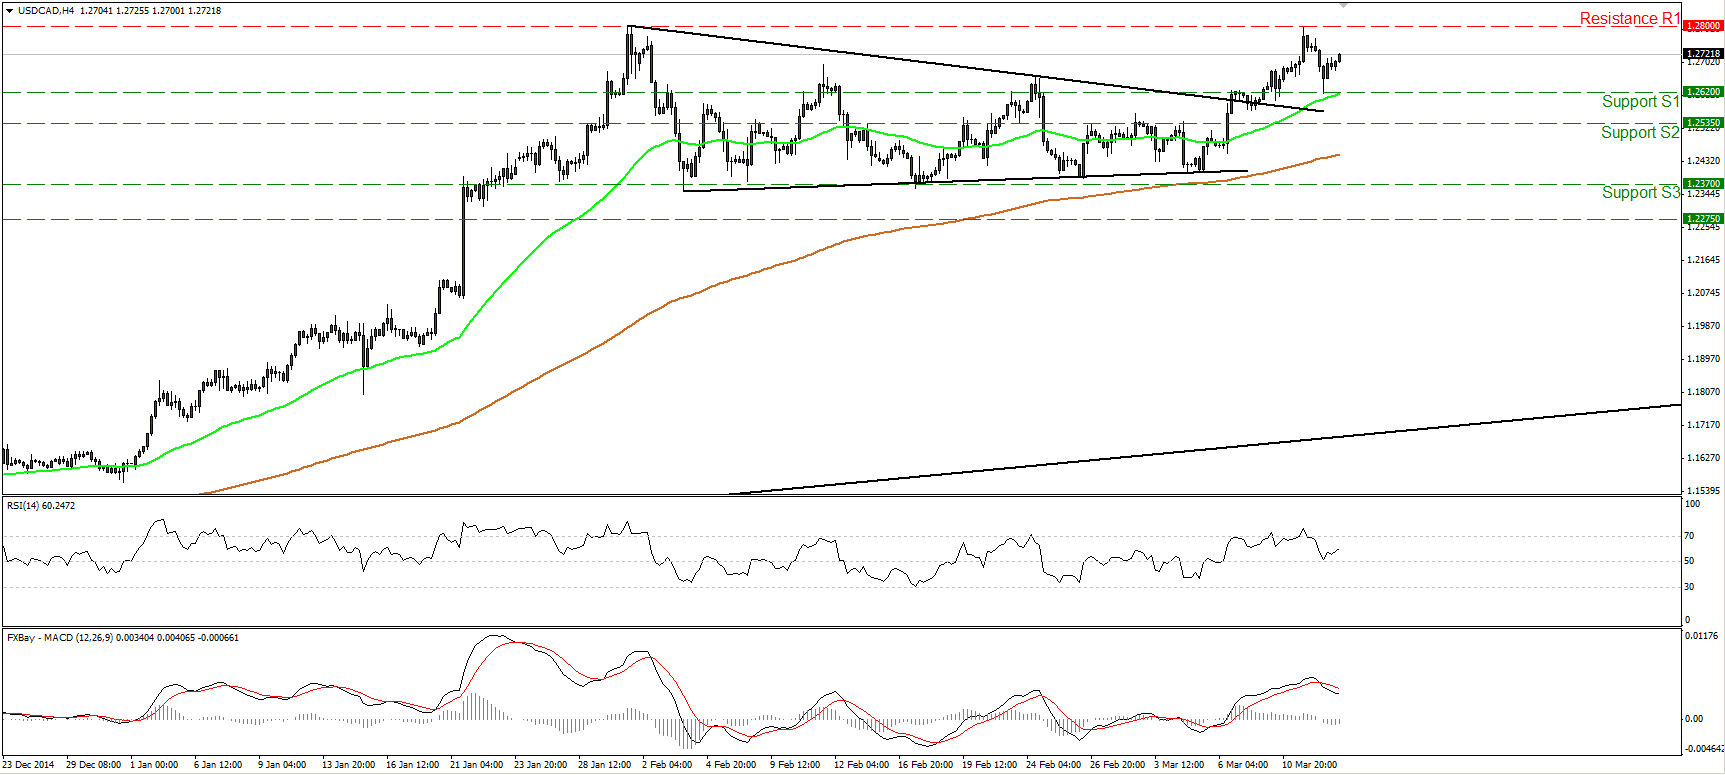
USD/CAD waits for Canada’s employment data
USD/CAD hit the 1.2800 (R1) resistance line on Wednesday and pulled back to find support at 1.2620 (S1), marginally above the 50-period moving average. Today we get Canada’s unemployment rate for February, which is expected to have risen. This could encourage the bulls to drive the rate above the 1.2800 (R1) hurdle. Such a break is likely to see scope for extensions towards our next resistance at 1.2900 (R2). Switching to the daily chart, the rate is still trading above the 50- and 200-day moving average. Moreover the upside exit of the triangle that had been containing the price action since the beginnings of February signaled a trend continuation. Therefore, the overall trend of this pair stays to the upside.
• Support: 1.2620 (S1), 1.2535 (S2), 1.2370 (S3).
• Resistance: 1.2800 (R1), 1.2900 (R2), 1.3000 (R3).
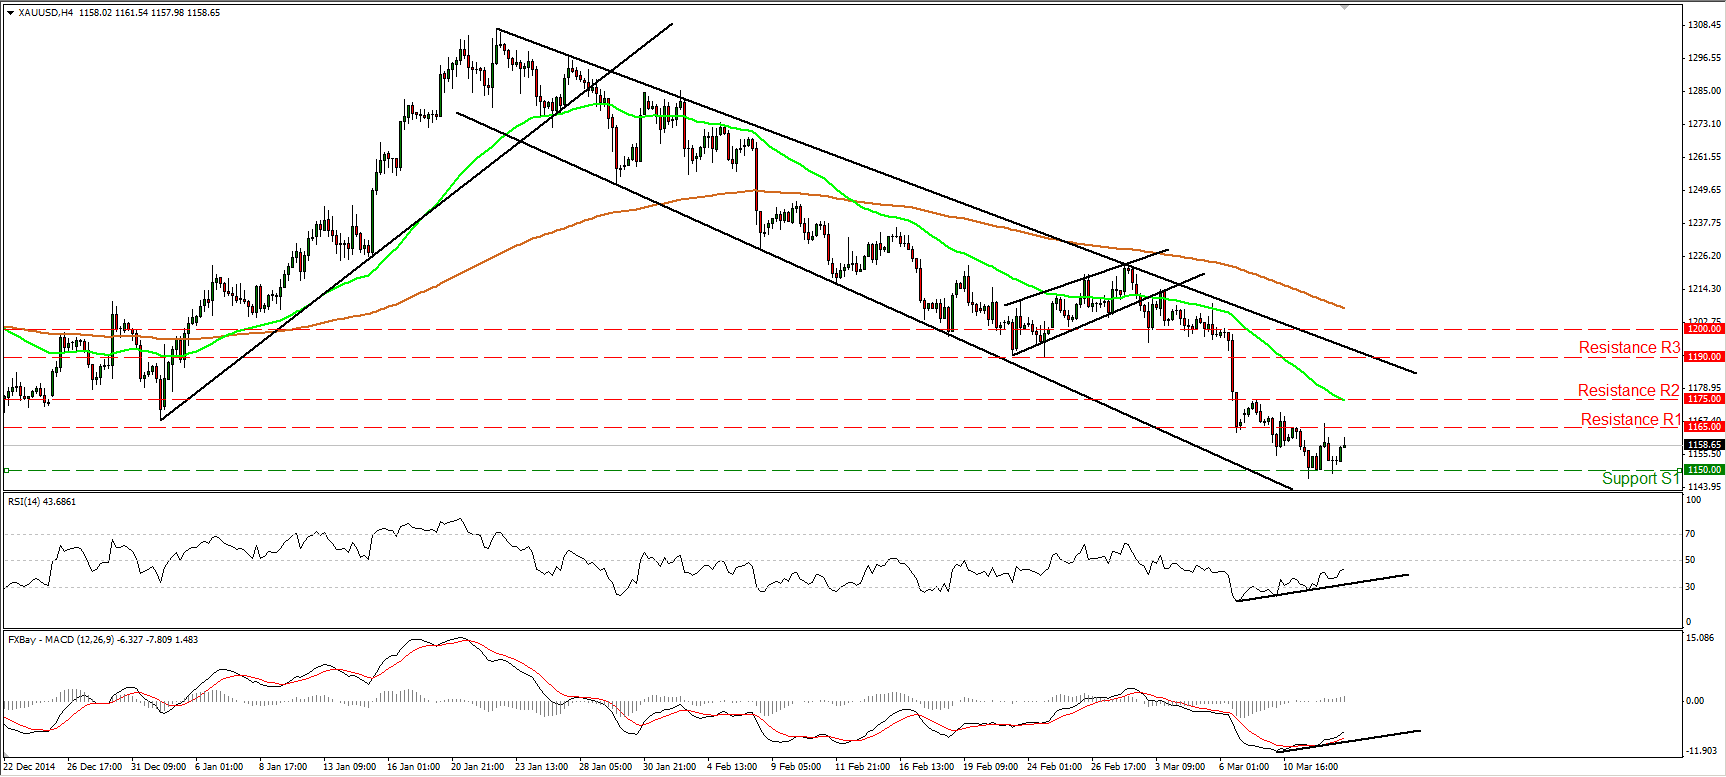
Gold stays above 1150
Gold rebounded from 1150 (S1) on Thursday, hit resistance near 1165 (R1), and subsequently retreated to find again support at the former line. The precious metal is still trading below both the 50- and the 200-period moving averages, and below the downtrend line taken from back at the high of the 22nd of January. Therefore I still consider the short-term outlook to be negative and would expect a break below 1150 (S1) to have more bearish extensions and perhaps trigger extensions towards the 1140 (S2) zone. However, there is still positive divergence between both our short-term oscillators and the price action, thus I would stay cautious that another upside corrective move could be in the works before sellers take control again.
• Support: 1150 (S1), 1140 (S2), 1130 (S3).
• Resistance: 1165 (R1), 1175 (R2), 1190 (R3).
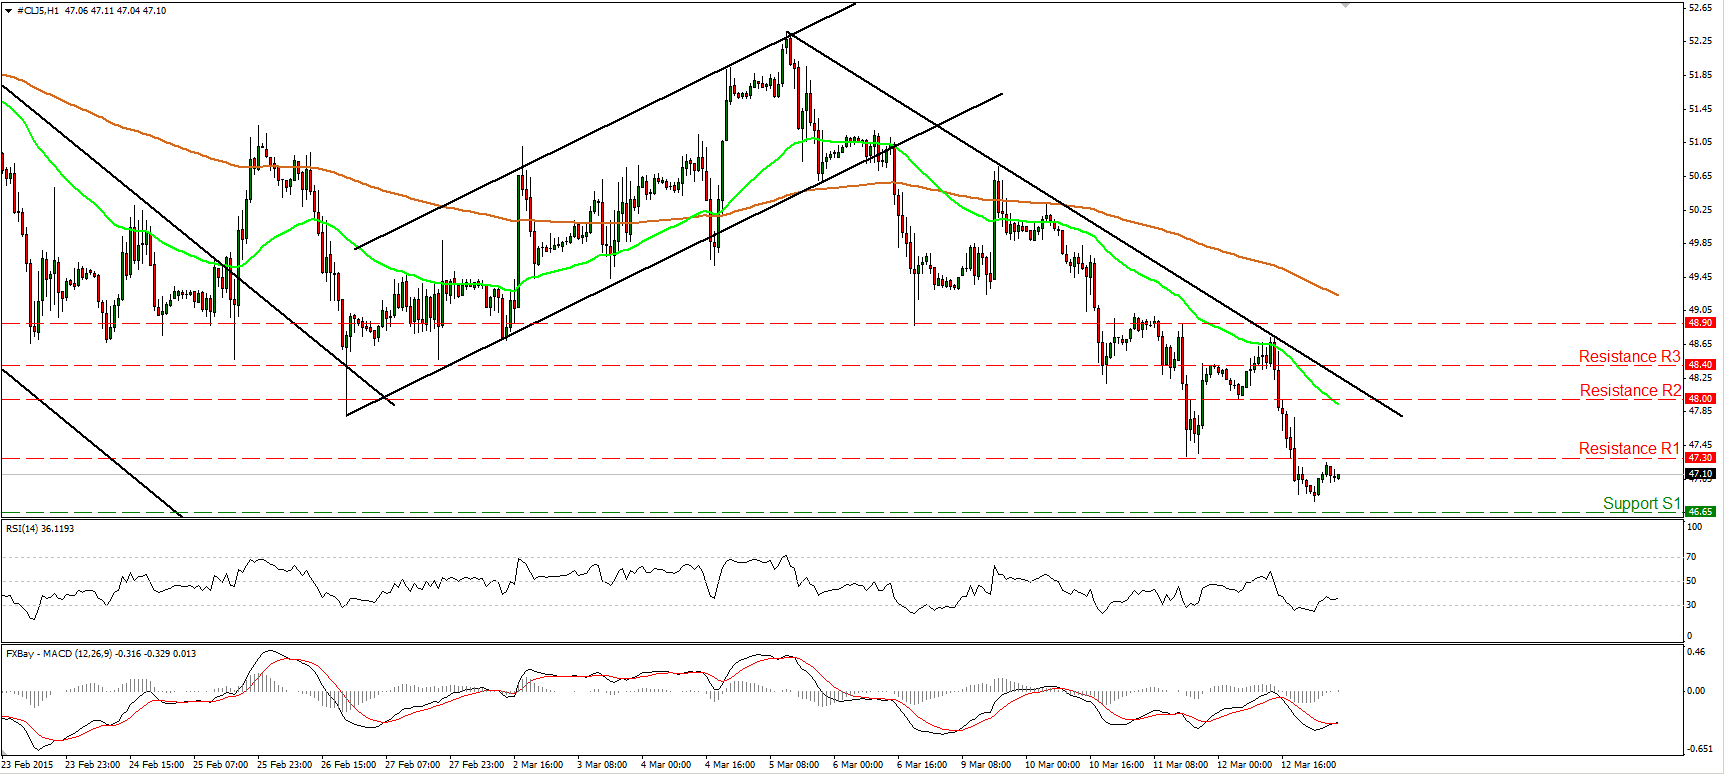
WTI hits the downtrend line and plummets
WTI rebounded somewhat during the European morning Thursday, but after hitting the downtrend line taken from the peak of the 5th of March, it plunge to break below 47.30 (R1), a support-turned-into resistance marked by Wednesday’s lows. Given that the price stays below the aforementioned trend line, I still see a negative short-term outlook. I would expect sellers to continue driving the battle lower and to challenge the support barrier of 46.65 (S1). A dip below that line could probably pull the trigger for the next support at 45.70 (S2). On the daily chart, WTI is still trading below both the 50- and the 200-day moving averages. It also managed to move below the low of the 26th of February. Meanwhile, the 14-day RSI left its 50 line and moved lower, while the MACD slid below both its zero and signal lines. This shifts the longer-term bias cautiously back to the downside, in my opinion.
• Support: 46.65 (S1), 45.70 (S2), 45.00 (S3).
• Resistance: 47.30 (R1) 48.00 (R2), 48.40 (R3).

