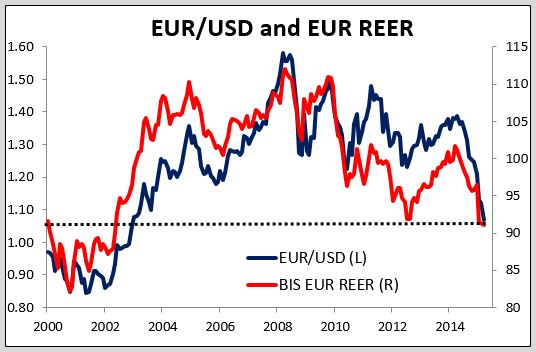
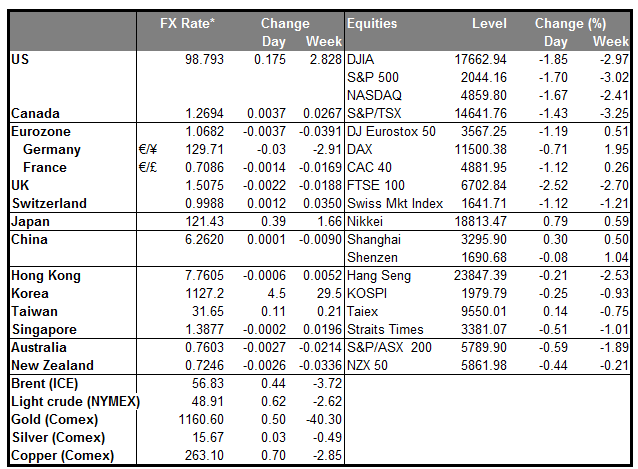
Dollar continues soaring, euro continues collapsing Nothing new here – the dollar just keeps on soaring and the euro just keeps on collapsing. EUR/USD and the DXY index are back at levels last seen in 2003. The dollar’s strength is particularly remarkable given that the action in the US rates markets hasn’t been USD-supportive. Fed funds futures rate expectations have lost about half the gains made on payroll Friday, while the 10-Year Treasury is back almost to where it was before the payroll data came out. So the effects of the higher payroll figure have faded in the rates market, but not in FX. Nor in US stocks either, which are down 2.7% from where they were at the close last Thursday and have lost all the gains made this year.
ECB policy, currency hedging may be behind the dollar’s rally. The immediate cause of the dollar rally, in my view, is the ECB’s decision to institute quantitative easing (QE). That’s the only thing that can explain the timing of the incredibly rapid decline in EUR/USD. From May 2008 when it hit 1.50 to 1.20 in June 2010 and back to 1.39 in March 2014, the entire range was 30 cents. (In fact, with the exception of a six-month period in 2008, the 1.20-1.50 range largely held for the 10 years from 2004 to 2014.) From March 2014 to now, the range has been 32 cents. So in one year we’ve had a bigger range than in the previous six years. Almost half of that move has been just this year as EUR/USD has fallen 14 cents. Nor has the decline been just against USD; the euro’s real effective exchange rate (REER), as calculated by the Bank for International Settlements, is also back to its 2002 level.
What changed to cause such a rapid move? While the start of the dollar’s strength may be associated with the beginning of the Fed’s “tapering” off of its QE program in January 2014, the big change this year has been ECB policy. I believe that foreign investors, who were big buyers of euro-denominated bonds in past years, have been taking profits as the eurozone bond market rallied ahead of QE and have been repatriating their money. In fact, net outflows from European assets have recently been running at a record high. While foreigners apparently have been buying European stocks, the flows in exchange-traded funds (ETFs) show that they’ve been doing so on a currency-hedged basis, so there has been no impact on the currency market.
The activity in European stocks brings up another possibility. For several years, foreigners were net buyers of European assets. Given the stability in EUR/USD over that time, they probably did not hedge their currency exposure. It’s likely that they are now rushing to do so, exacerbating the currency impact of the record outflow from European assets. My conclusion: the exodus from European bonds and the hedging activity of investors is likely to continue for some time, meaning these trends are likely to remain in place for the long term.
China data: China released some data this morning, which was generally below estimates, justifying the PBoC’s decision to cut interest rates further in order to boost the economy. Retail sales were up 10.7% yoy, below estimates of 11.6%. Industrial production was up 6.8% yoy, below estimates of 7.7%. And fixed asset investment was up 13.9% yoy, below estimates of 15.0%. The news is likely to weigh on AUD and NZD today.
Today’s highlights: During the European day, in Sweden, we get the CPI for February. Swedish CPI is forecast to be unchanged yoy, exiting deflationary territory, while the CPIF – the Bank’s favorite inflation measure - is expected to accelerate. We could see a short-lived strengthening of the currency, as this would confirm Riksbank board’s belief that the underlying inflation has bottomed out. However, while a CPI rate of 0% yoy is no longer deflation, it’s still far below +2% target. On top of that, last Thursday’s attempt by the Governor Ingves’ to talk down the currency and the Board’s stated readiness to take further action if necessary to lift the prices only reinforces our view that USD/SEK has plenty room to the upside.
In the UK, industrial production for January is forecast to have risen 0.3% mom after falling 0.2% mom in December. This would be the first rise after three consecutive months of declines and so could prove GBP-positive.
We have several ECB speakers on Wednesday’s agenda: ECB President Mario Draghi, ECB Executive Board member Peter Praet, ECB Governing Council member Erkki Liikanen and ECB Governing Council member Ewald Nowotny speak. Bank of England MPC member Martin Weale also speaks. RBNZ Governor Graeme Wheeler will hold a press conference after the rate decision (see below) and will subsequently appear at a Parliament Select Committee.
Then on Thursday, the highlight will be the Reserve Bank of New Zealand policy meeting. The Bank is expected to leave its policy rate unchanged at 3.5%. At its January meeting, the Bank said that they expect to keep the OCR on hold for some time, but they also added that future interest rate adjustments, either up or down will depend on the data. Since then, NZD strengthened instead and economic data have not been that supportive. This adds to the possibility that the Bank will maintain its neutral bias or even cut rates, in our view. The market view is that the RBNZ will hold rates steady; the overnight index swap market is assigning a 92% probability to that outcome, while 11 out of 13 analysts surveyed on Bloomberg also thought there was likely to be no change. On the contrary, we believe that a 25 bps rate cut seems likely, instead of Governor just trying to talk down the currency again. Given the market positioning, this would be quite a shock to the market and we would expect NZD to depreciate substantially if it happens.
The Market
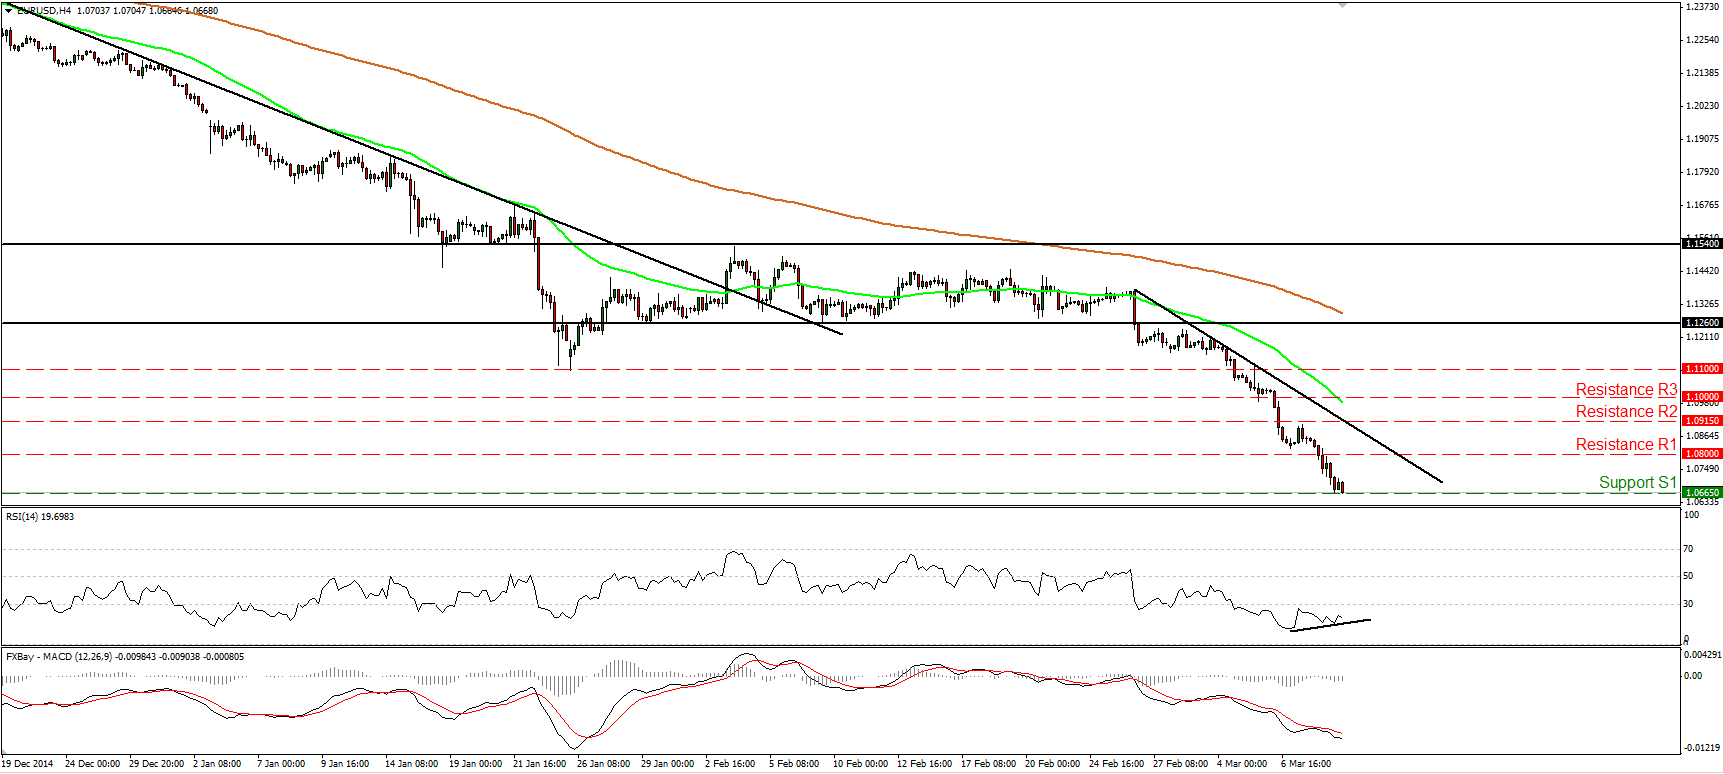
EUR/USD finds support at 1.0665
EUR/USD continued sliding on Tuesday and during the early European morning it is trading near 1.0665 (S1). The short-term bias remains to the downside and I would expect the rate to continue lower and challenge the next support obstacle at 1.0565 (S2) defined by the 7th of April 2003 low. However, bearing in mind that there is positive divergence between the RSI and the price action, I would be careful that a minor corrective bounce may occur before the next leg down. With regards to the broader trend, I believe that the pair is still in a downtrend. EUR/USD is printing lower peaks and lower troughs below both the 50- and the 200-day moving averages.
• Support: 1.0665 (S1), 1.0565 (S2), 1.0500 (S3).
• Resistance: 1.0800 (R1), 1.0915 (R2), 1.1000 (R3).
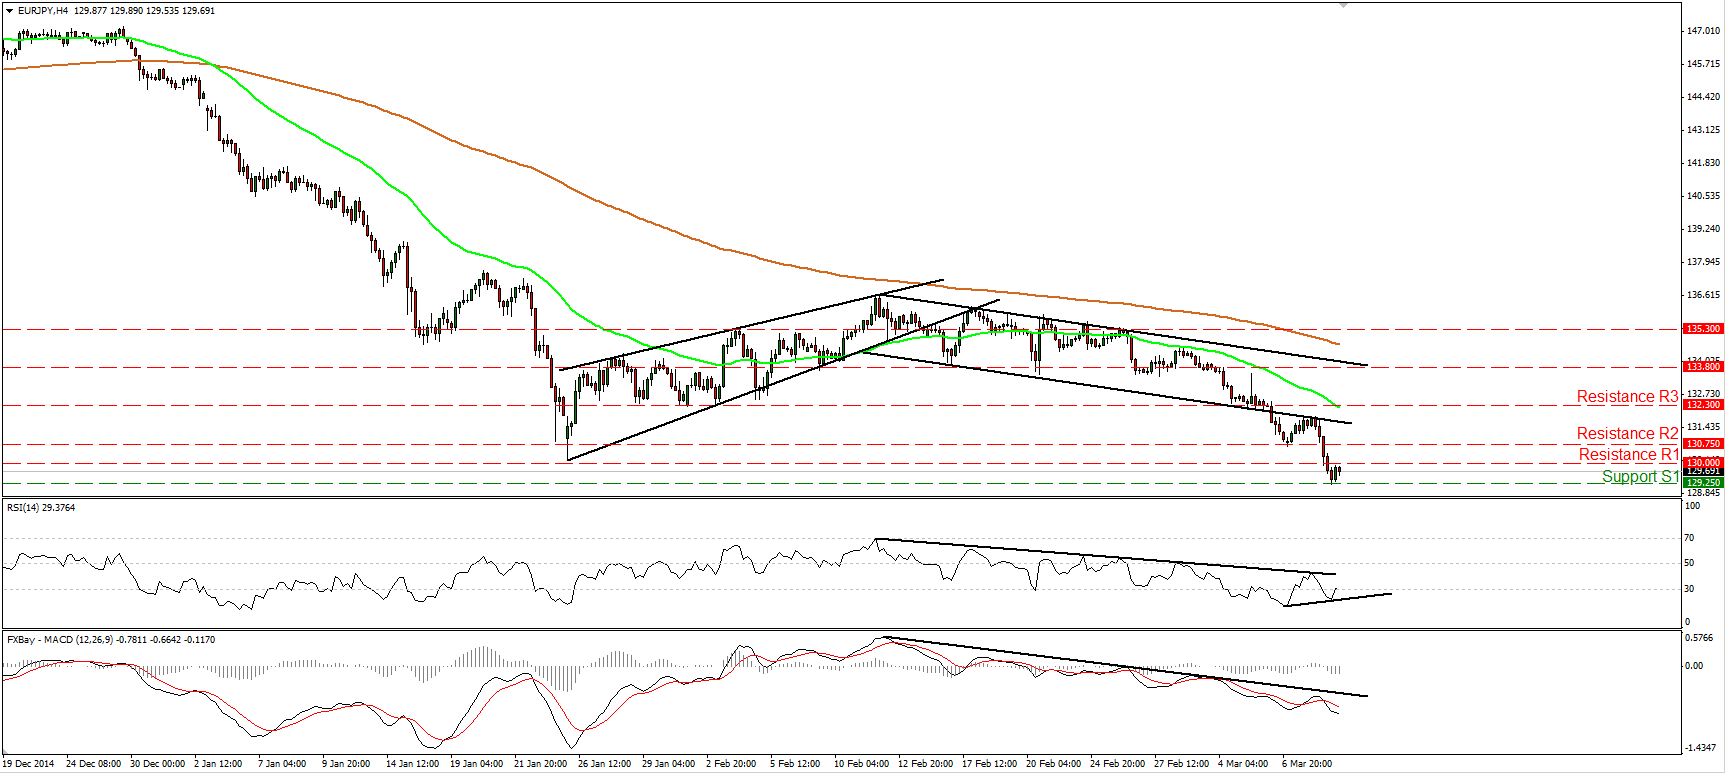
EUR/JPY falls below 130.00
EUR/JPY tumbled after hitting resistance at the lower line of the near-term downside channel, and managed to breach the psychological round number of 130.00 (R1). The rate is now trading between that hurdle and the support line of 129.25 (S1), defined by the low of the 30th of August 2013. The bias stays to the downside, thus I would expect a clear move below 129.25 (S1) to pull the trigger for the 128.00 (S2) area, marked by the low of 12th of August 2013. Nevertheless, given that there is positive divergence between the RSI and the price action, I would be mindful that a minor bounce back above 130.00 could be in the works before the next leg down. On the daily chart, the dip below the round figure of 130.00 (R1) confirmed a forthcoming lower low and signaled the continuation of the longer-term downtrend.
• Support: 129.25 (S1), 128.00 (S2), 126.65 (S3).
• Resistance: 130.00 (R1), 130.75 (R2), 132.30 (R3).
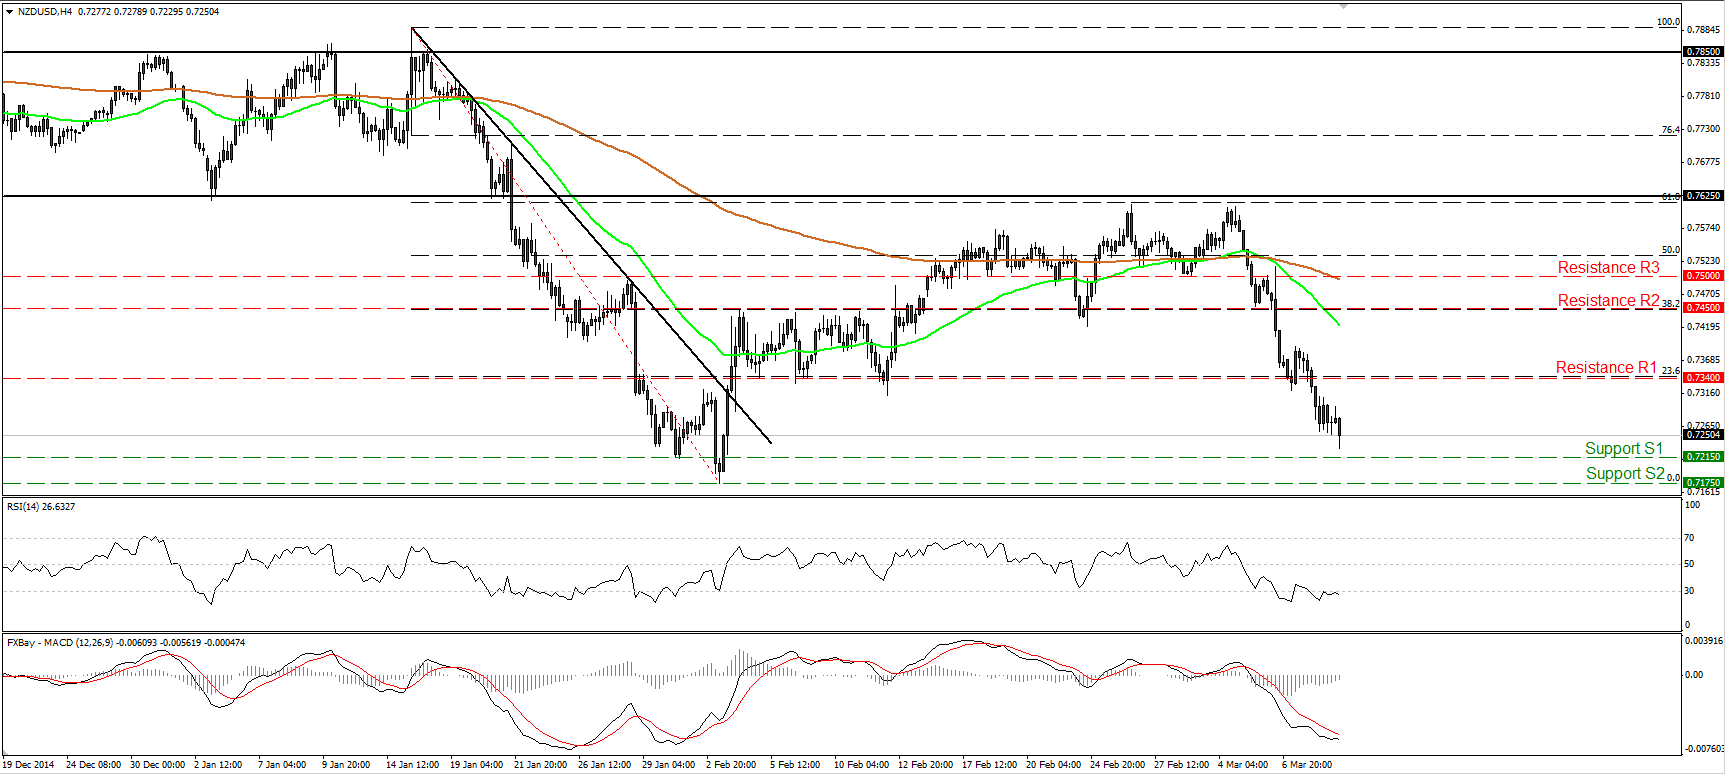
NZD/USD falls below 0.7340
NZD/USD continued lower and fell below the key support (now turned into resistance) area of 0.7340 (R1). During the early European morning, the rate is heading towards the support line of 0.7215 (S1), where a dip could challenge the low of the 3rd of February, at 0.7175 (S2). Our momentum studies detect strong downside momentum and amplify the case for the continuation of the fall. The RSI hit resistance at its 30 line and turned down, while the MACD stays below both its zero and signal lines. In the bigger picture, the plunge from near 0.7625 confirmed my view that the recovery from 0.7175 (S2) was just a corrective move and that the overall downtrend is back in force.
• Support: 0.7215 (S1), 0.7175 (S2), 0.7000 (S3).
• Resistance: 0.7340 (R1), 0.7450 (R2), 0.7500 (R3).
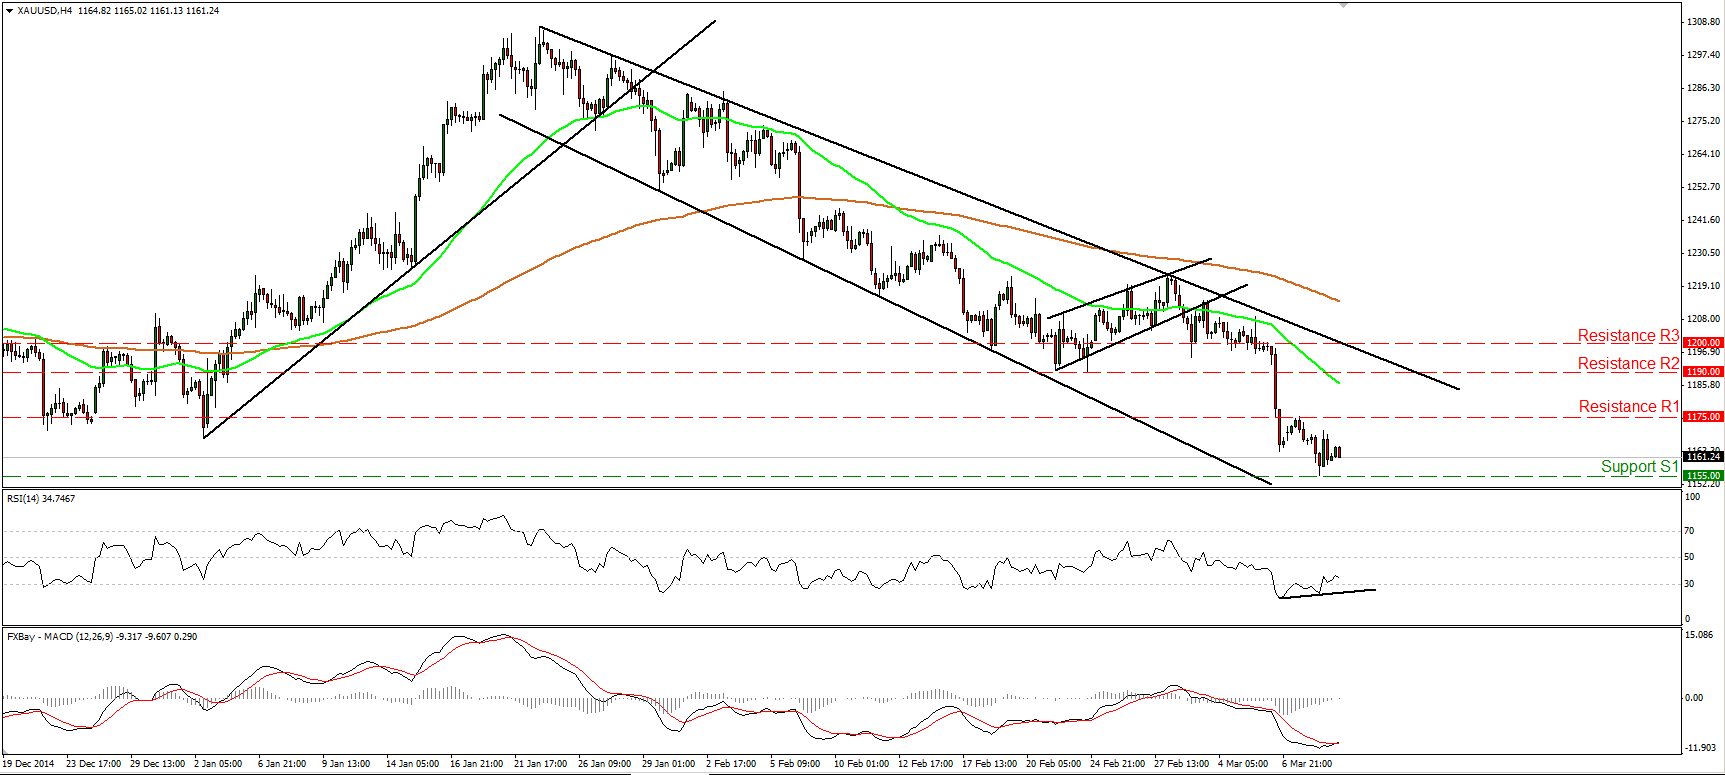
Gold finds support at 1155
Gold traded lower yesterday but hit support at 1155 (S1) and rebounded. The precious metal is still trading below both the 50- and the 200-period moving averages, and below the downtrend line taken from back at the high of the 22nd of January. Therefore I still consider the short-term outlook to be negative and I still expect a test of 1150 (S2) in the near future. A break below that barrier could trigger extensions towards the 1140 (S3) zone. However, taking a look at our short-term oscillators I would stay cautious that an upside corrective move could be in the works before sellers take control again. The RSI exited its oversold territory while the MACD has bottomed and poked its nose above its trigger line. Moreover, there is positive divergence between the RSI and the price action.
• Support: 1155 (S1), 1150 (S2), 1140 (S3).
• Resistance: 1175 (R1), 1190 (R2), 1200 (R3).
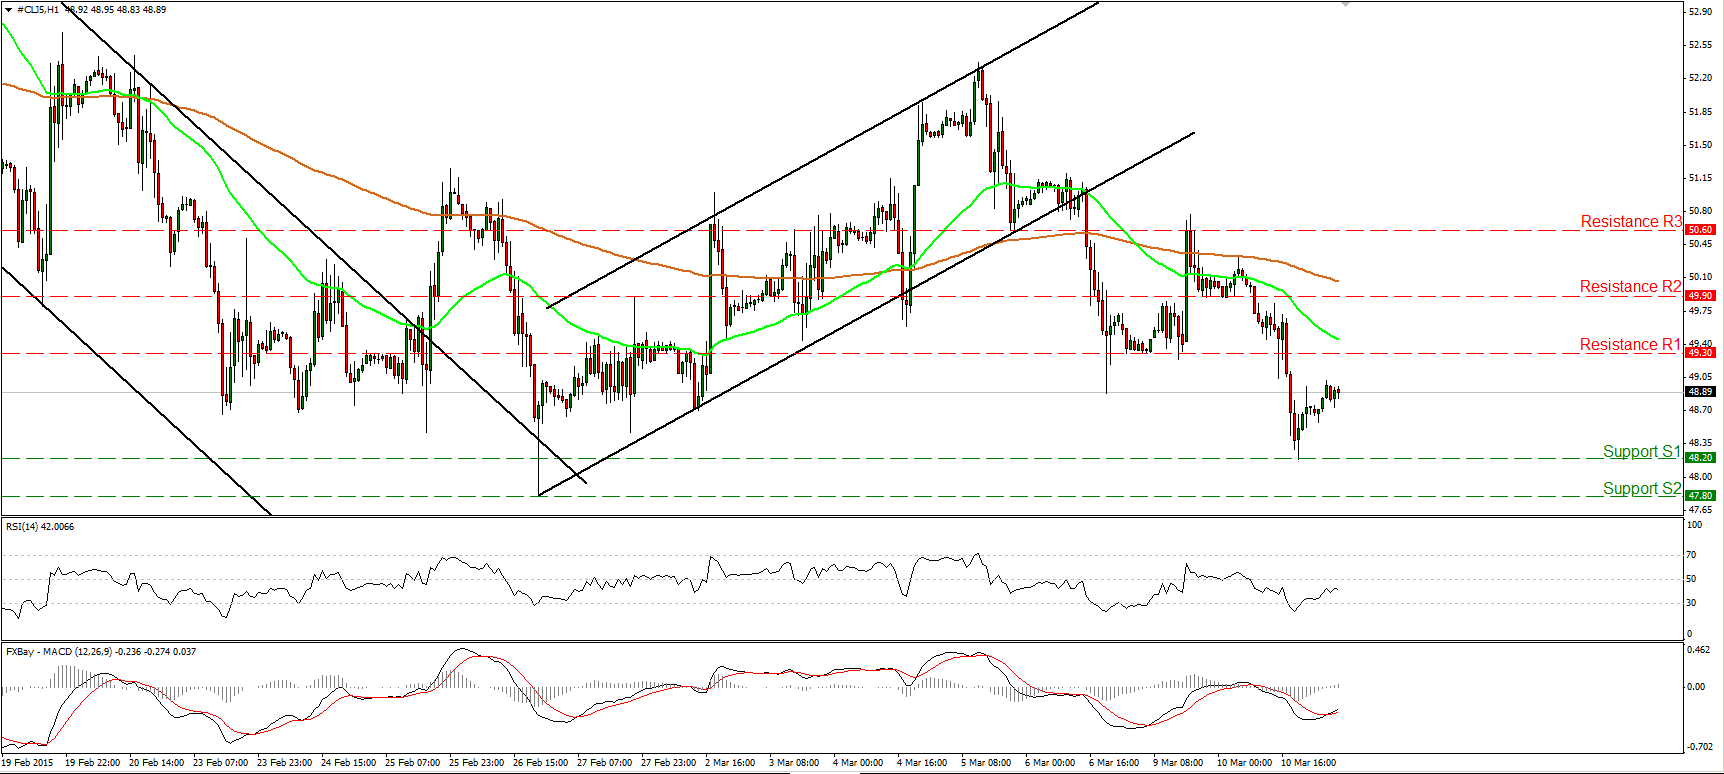
WTI falls and hits support at 48.18
WTI plunged on Tuesday, but hit support at 48.20 (S1) and then rebounded. Although the rebound may continue for a while, the short-term outlook is back to the downside in my view and I would expect to see another test at the 48.20 (S1) line soon. The reason I believe the rebound may continue a bit more is because the RSI edged higher after exiting its oversold territory, while the MACD, although negative, went over its trigger line. On the daily chart, WTI is still trading below both the 50- and the 200-day moving averages. Nevertheless, it managed to print a higher low on the 26th of February. Also, both the daily momentum indicators gyrate around their neutral lines. For now, I would prefer to sit on the side lines as far as the overall picture is concerned.
• Support: 48.20 (S1), 47.80 (S2), 47.40 (S3).
• Resistance: 49.30 (R1) 49.90 (R2), 50.60 (R3).

