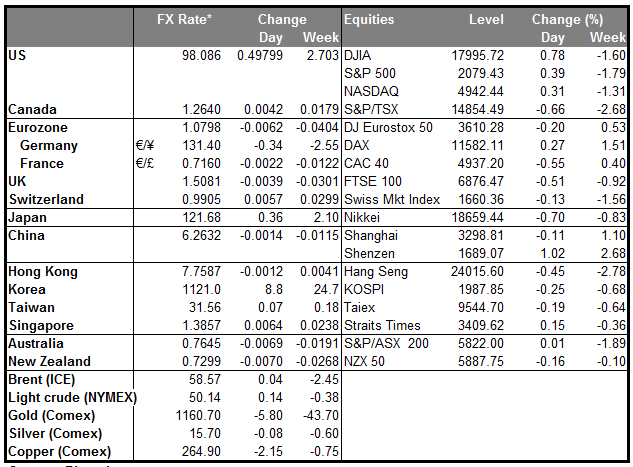
Plunge in Bund yields suggests EUR can fall further Yesterday was the first day for the ECB’s quantitative easing program. While one might have thought it was fully priced in by now, in fact German 10-Year yields collapsed 8 bps to 0.31%, a huge move considering how low they are already (the record low was 0.30% on Feb. 26th). By comparison, Italian 10-Year yields were down only 4 bps and Portuguese 10-Year yields were virtually unchanged. The big move in Bunds suggests that the move was not totally priced into the bond markets, which means it may not have been totally priced into the FX market, either. That suggests EUR can still fall further.
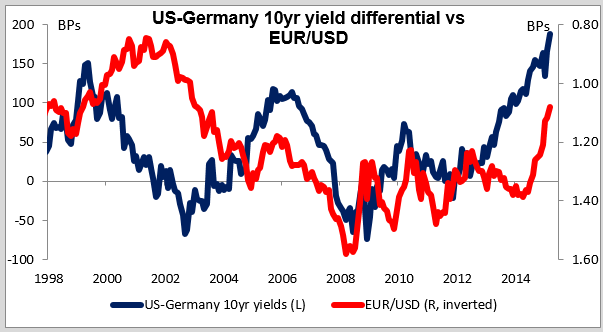
Greek situation still critical Apparently the recent “solution” to Greece’s problems was no solution at all. They have not even started negotiations. “Little has been done,” according to Eurogroup Chairman Dijsselbloem. “Technical level” talks between Athens and its creditors will start in Brussels on Wednesday. “What I know is that we can only release further loans from the European funds if there is full agreement on the total package and if they start implementing the program. So far two weeks have gone by and neither of the two have happened,” said Dijsselbloem. Apparently the creditor group wasn’t impressed with Greece’s reform proposals; two representatives of the group called them “amateurish” and said they don’t signal substantial progress to meeting the country’s commitments. Greece is apparently still short some EUR 1bn for March, when about EUR 2bn of debt-servicing payments come due. Note that while yields elsewhere in the Eurozone were unchanged to lower thanks to QE, Greek three-year yields were up almost 200 bps yesterday! The yield spread between Treasuries and Bunds is now at a record wide level. So QE further compresses the risk premium in European bond yields even while the risk in EUR remains acute; not a good combination for the currency!
Two more Fed speakers back mid-year hike Cleveland Fed President Loretta Mester said the US economy had built up “sustainable momentum” and repeated that she’s “comfortable” with an interest rate rise in the first half of the year. This is no surprise as she has previously said that “we want to bring the policy rate up.” Mester does not vote this year. Richard Fisher, who is stepping down soon as President of the Dallas Fed, warned against waiting too long to raise rates and said policy makers should raise rates before the economy reaches full employment. Fisher is a known super-hawk who is no longer on the FOMC so he will not have any say in making policy. On the other hand, we have yet to hear any voices urging the Fed to wait. (Note: yesterday’s schedule was incorrect. Minneapolis Fed President Kocherlakota did not speak yesterday.) Nonetheless, Fed funds rate expectations were down 4 bps in the long end as the market unwound some of the post-NFP move,
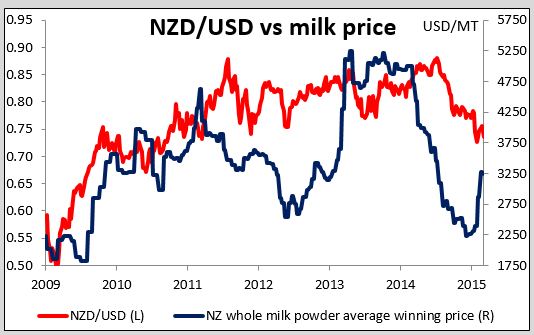
Kiwi crying over spoiled milk? NZD fell sharply as trading in dairy futures and options and shares in dairy companies were halted. The police are investigating a criminal threat to poison infant formula unless the country stops using a certain pesticide. This would cause huge damage to the world’s biggest dairy exporter. New Zealand exported NZD 1.2bn of dairy products last year, accounting for 29% of total exports. No trace of the poison was found. Nonetheless, the threat could weigh on NZD until it’s resolved. Meanwhile, AUD was down even more than NZD compared to yesterday’s European opening, after the National Australia Bank Business confidence index for February fell.
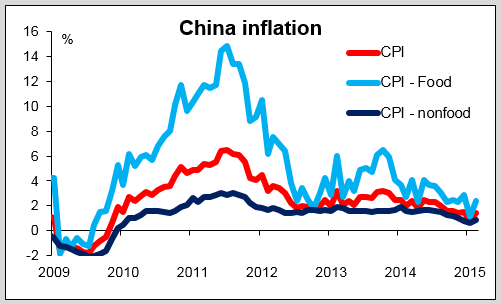
China’s inflation rises as food prices jump China’s CPI rose faster than expected at 1.4% yoy (expected: +1.0%, previous: 0.8%) but the PPI fell more than expected at -4.8% yoy (expected and previous: -4.3%). Inflation is focused in food, which may have had something to do with the timing of the Chinese New Year: food inflation jumped to +2.4% yoy from +1.1%, while non-food inflation rose only from +0.6% to +0.9%. It’s China’s non-food inflation that’s important for the rest of the world, not its food inflation. In any event, the overall inflation rate remains very low, and with the money supply target for this year lower than the actual result for last year, I don’t expect the inflation rate to rise particularly. Given China’s prominence as a trading nation, this disinflationary impulse is likely to keep downward pressure on prices globally and continue the “currency wars” that the financial world has fallen into as a result of central banks’ anti-deflation stance.
Today’s highlights: We have a relatively light day today as regards indicators. During the European session, French industrial production for January is expected to fall, a turnaround from the previous month.
In Norway, the CPI is forecast to have accelerated in February, probably due to the fact that the effect of lower oil prices is gradually fading. This could support the Krone temporarily as the market tries to anticipate the result of the Norges Bank monetary policy meeting on the 19th of March.
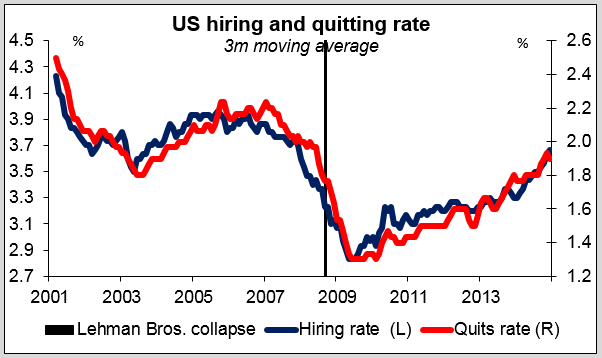
In the US, only data of secondary importance are coming out. The NFIB small business optimism for February is expected to have increased a bit, staying fractionally below its December 7-year high. While this indicator is not particularly market-affecting, it’s well worth watching because of the Fed’s emphasis on employment. Small businesses employ the majority of people in the US. The Job Opening and Labor Turnover Survey (JOLTS) report for January is forecast to show that the number of job openings has increased marginally. The market will also be watching for the “quit rate,” which Fed Chair Janet Yellen recently singled out as “a barometer of worker confidence in labor market opportunities.” Following last week’s strong employment data, this is likely to keep the USD supported. Wholesale inventories for January are also coming out.
As for the speakers, ECB Governing council member Ewald Nowotny, BoE Governor Mark Carney and BoE MPC member Ian McCafferty speak.
The Market
EUR/USD finds support below 1.0800
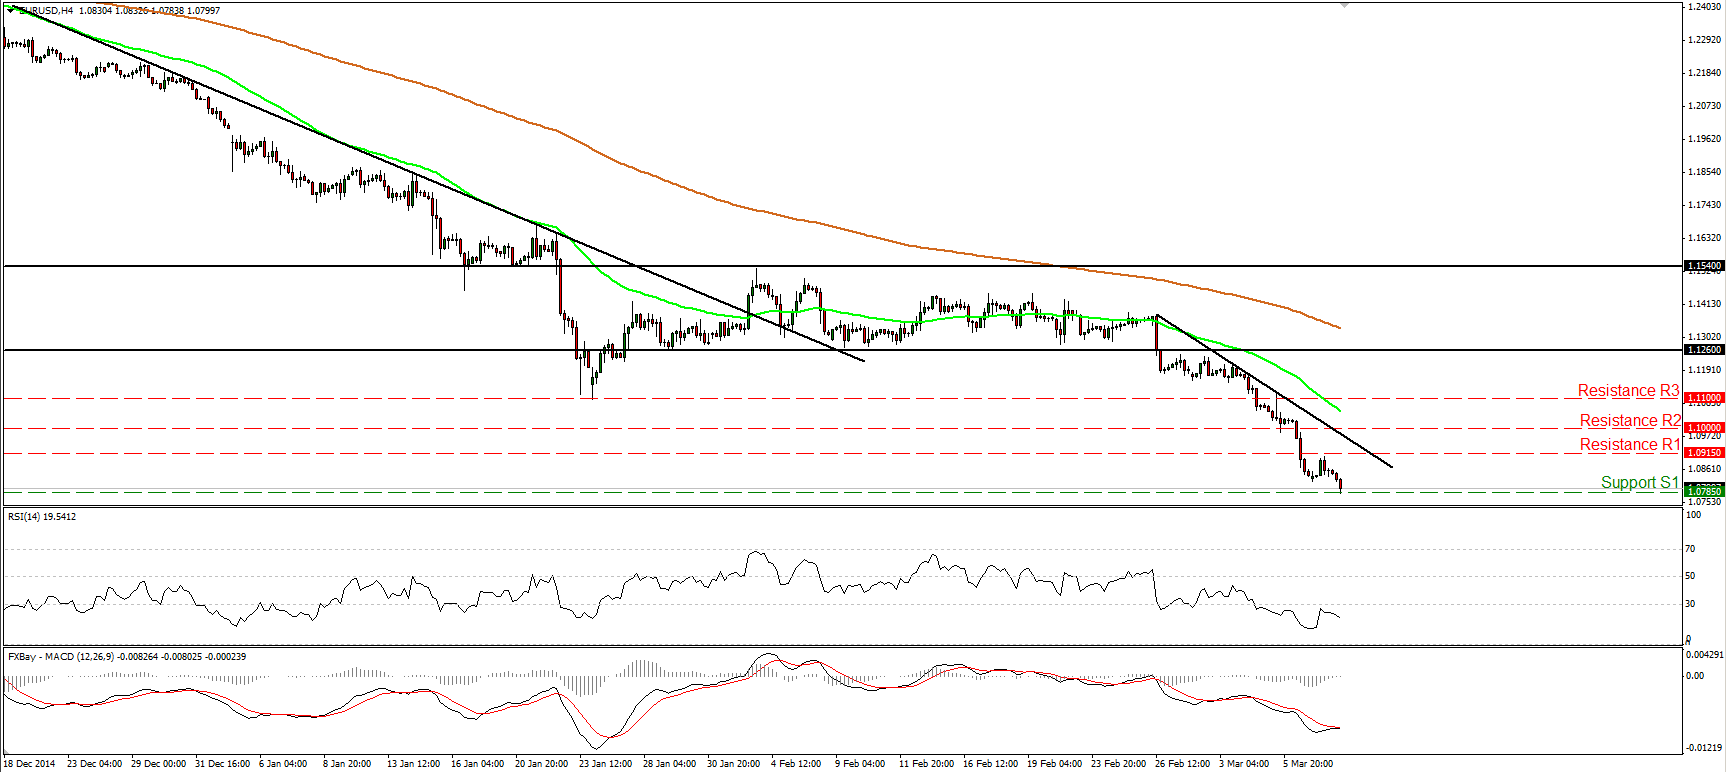
EUR/USD moved somewhat higher, hit resistance fractionally below the 1.0915 (R1) line, and tumbled again to find support below 1.0800, at 1.0785 (S1). The short-term bias remains to the downside and I would expect the rate to continue lower and challenge the next support obstacle at 1.0700 (S2), defined by the low of the 11th of April 2003. Our technical oscillators detect accelerating downside speed and amplify the case for a lower EUR/USD. The RSI, already within its oversold territory, hit resistance near its 30 line and turned down again, while the MACD lies below both its zero and signal lines. With regards to the broader trend, I believe that the pair is still in a downtrend. EUR/USD is printing lower peaks and lower troughs below both the 50- and the 200-day moving averages.
• Support: 1.0785 (S1), 1.0700 (S2), 1.0565 (S3).
• Resistance: 1.0915 (R1), 1.1000 (R2), 1.1100 (R3).
USD/JPY rallies and hits resistance near 122.00
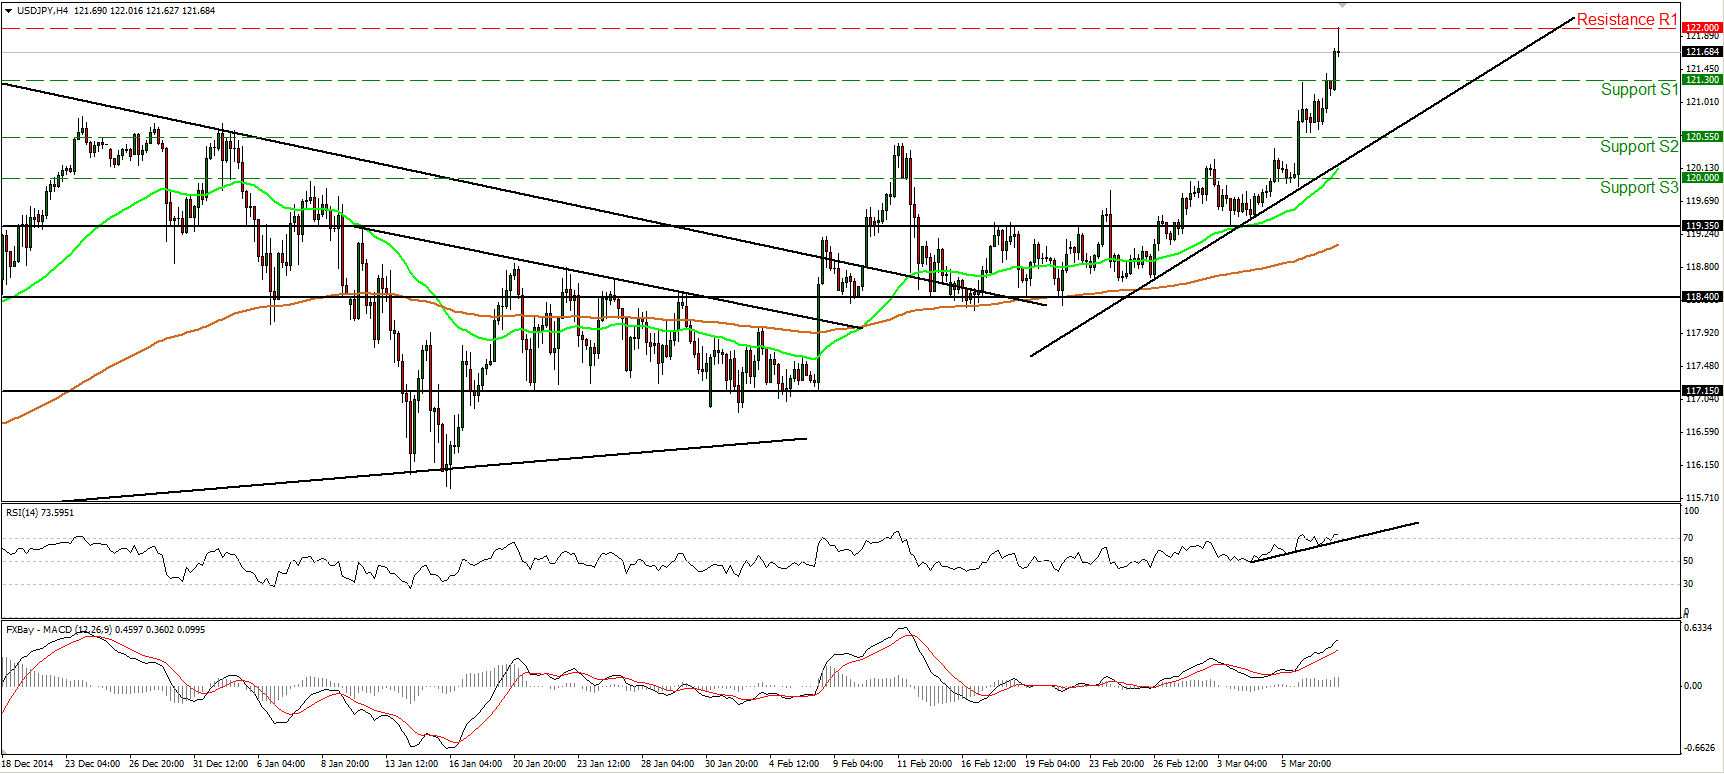
USD/JPY accelerated higher yesterday and managed to hit the 122.00 (R1) line, a resistance barrier that stands near the level of the highest point of the triangle that had been containing the price action since November (identified on the daily chart). As long as the rate is printing higher highs and higher lows above both the 50- and the 200-period moving averages, the near-term bias remains to the upside. This is also supported by our short-term oscillators. The RSI moved higher and entered its above-70 zone, while the MACD stands above both its zero and signal lines pointing north. A move above 122.00 (R1) is likely to challenge the 122.50 (R2) line, marked by the high of the 20th of July 2007. As for the broader trend, the rate is still trading above both the 50- and the 200-day moving averages, and above the upper bound of the aforementioned triangle. This keeps the overall picture of USD/JPY positive.
• Support: 121.30 (S1), 120.55 (S2), 120.00 (S3).
• Resistance: 122.00 (R1), 122.50 (R2), 124.00 (R3).
EUR/GBP continues its tumble
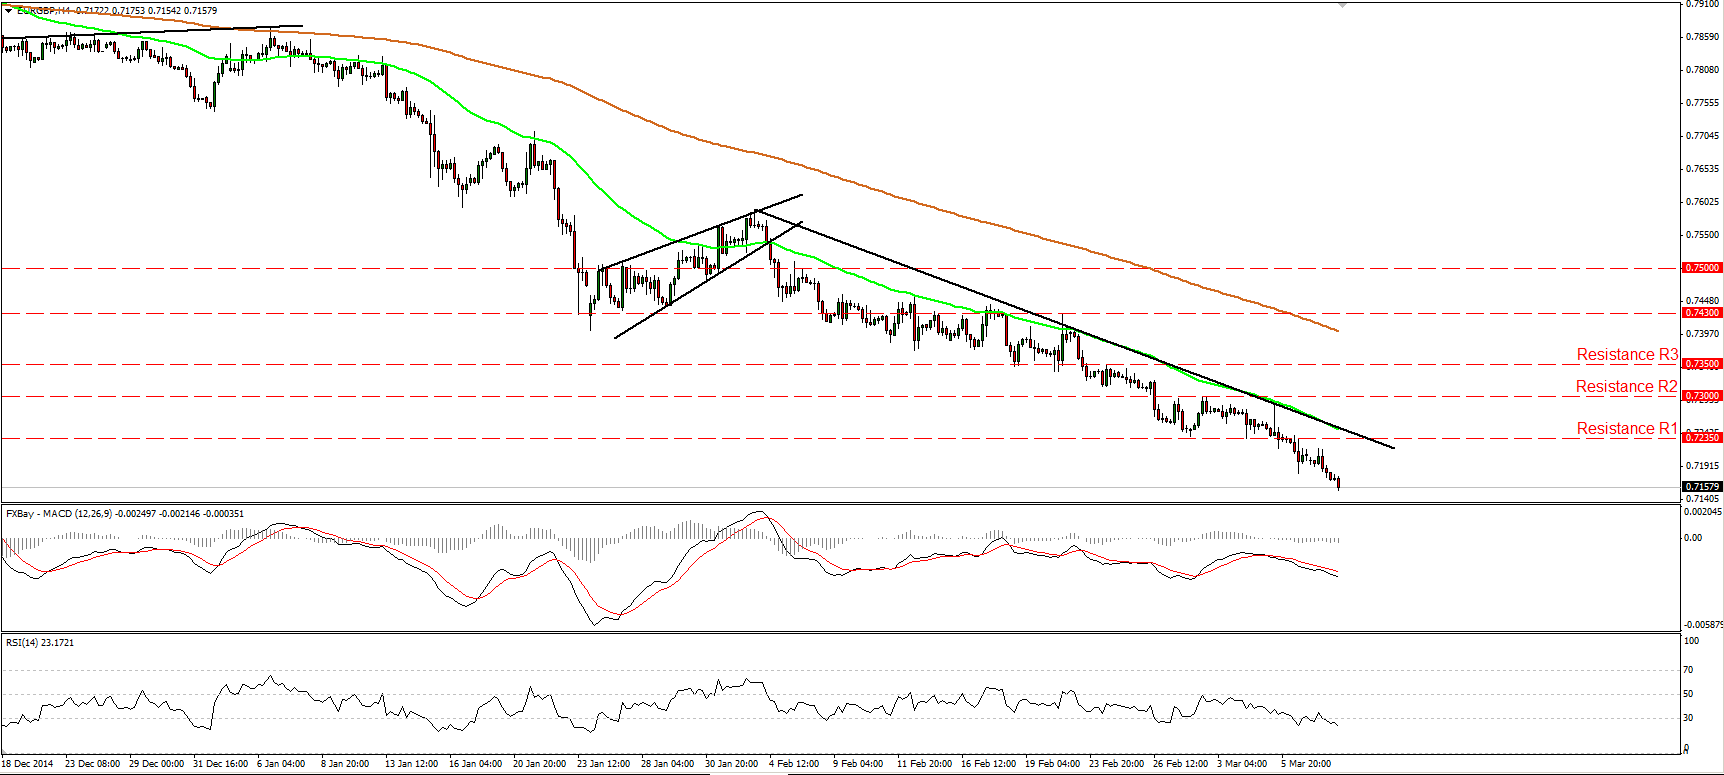
EUR/GBP continued its slide to hit a 7-year low after falling below the support (turned into resistance) of 0.7235 (R1). The rate is trading below the downtrend line taken from the high of the 3rd of February and below both the 50- and the 200-period moving averages. This keeps the bias negative and amplifies the case for extensions towards the 0.7100 (S1) territory, marked by the lows of the 3rd and 4th of December 2007. Taking a look at our oscillators, I see that the RSI is back below 30, while the MACD, already negative, stands below its signal line and points down. As for the broader trend, the downside exit of the triangle pattern on the 18th of December signaled the continuation of the longer-term downtrend. Since then, the price structure has been lower peaks and lower troughs below both the 50- and the 200-day moving averages, thus I would stay bearish on the overall path of this exchange rate.
• Support: 0.7100 (S1), 0.7025 (S2), 0.7000 (S3).
• Resistance: 0.7235 (R1), 0.7300 (R2), 0.7350 (R3).
Gold dips below 1165
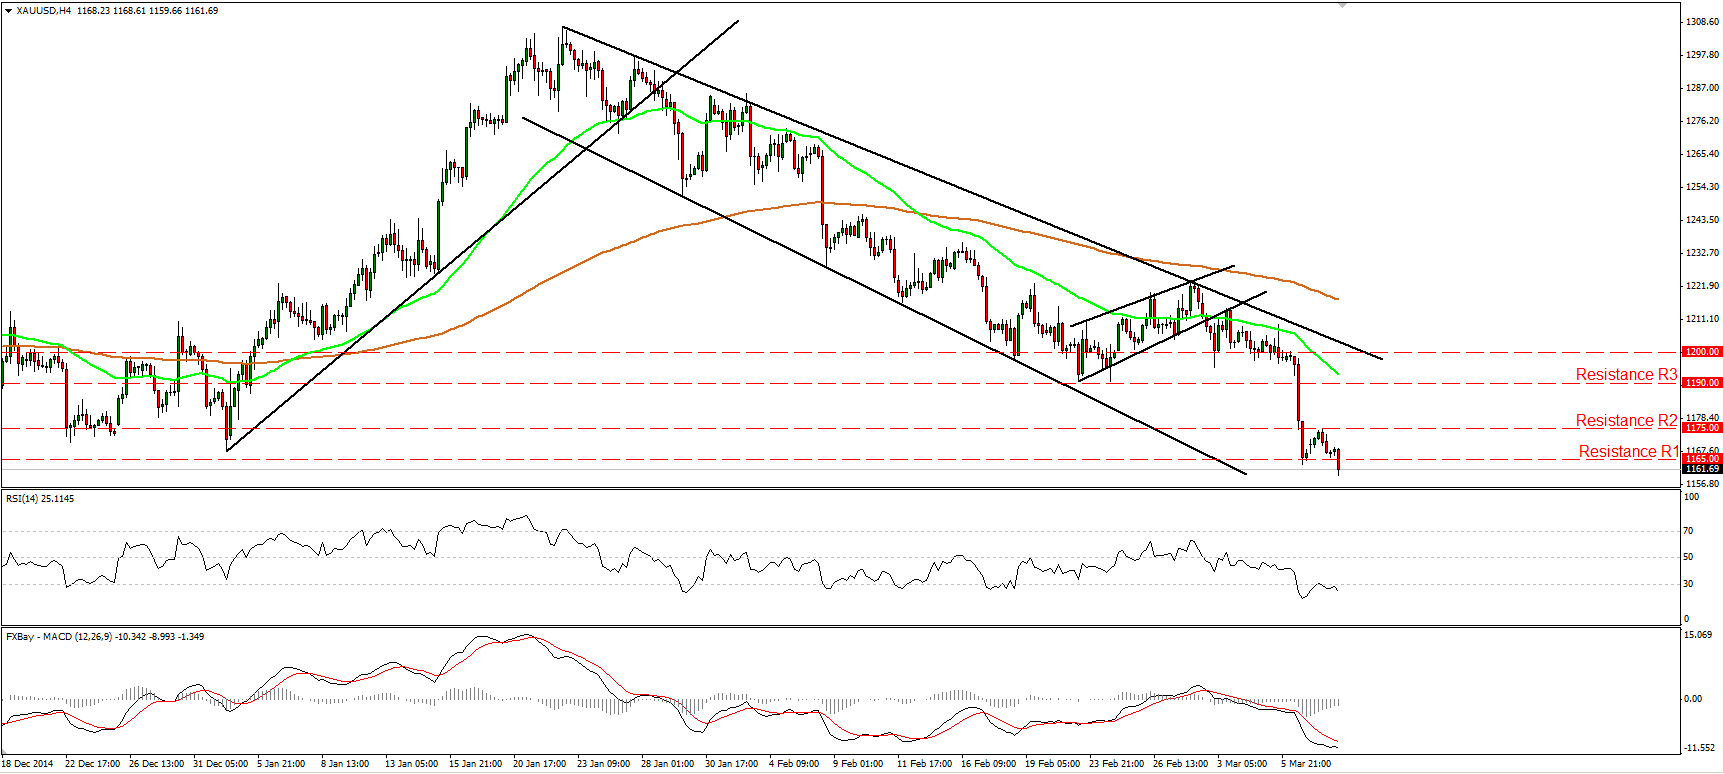
Gold slid after hitting resistance at 1175 (R2) and dipped below the support (now turned into resistance) of 1165 (R1). Bearing in mind that the yellow metal is trading below both the 50- and the 200-period moving averages, and below the downtrend line taken from back the high of the 22nd of January, I still consider the near-term outlook to be negative. I would expect the move below 1165 (R1) to have more bearish implications and perhaps target our next support hurdle at 1150 (S1). Our near-term momentum studies corroborate my view. The RSI hit resistance at its 30 line and turned down, while the MACD stays below both its zero and trigger lines, indicating strong downside momentum. As for the bigger picture, the break below the 1190 (R3) (support turned into resistance) zone is the move that confirmed a forthcoming lower low on the daily chart and signaled the continuation of the fall from 1307.
• Support: 1150 (S1), 1140 (S2), 1130 (S3).
• Resistance: 1165 (R1), 1175 (R2), 1190 (R3).
WTI shoots up and trades around 50 again
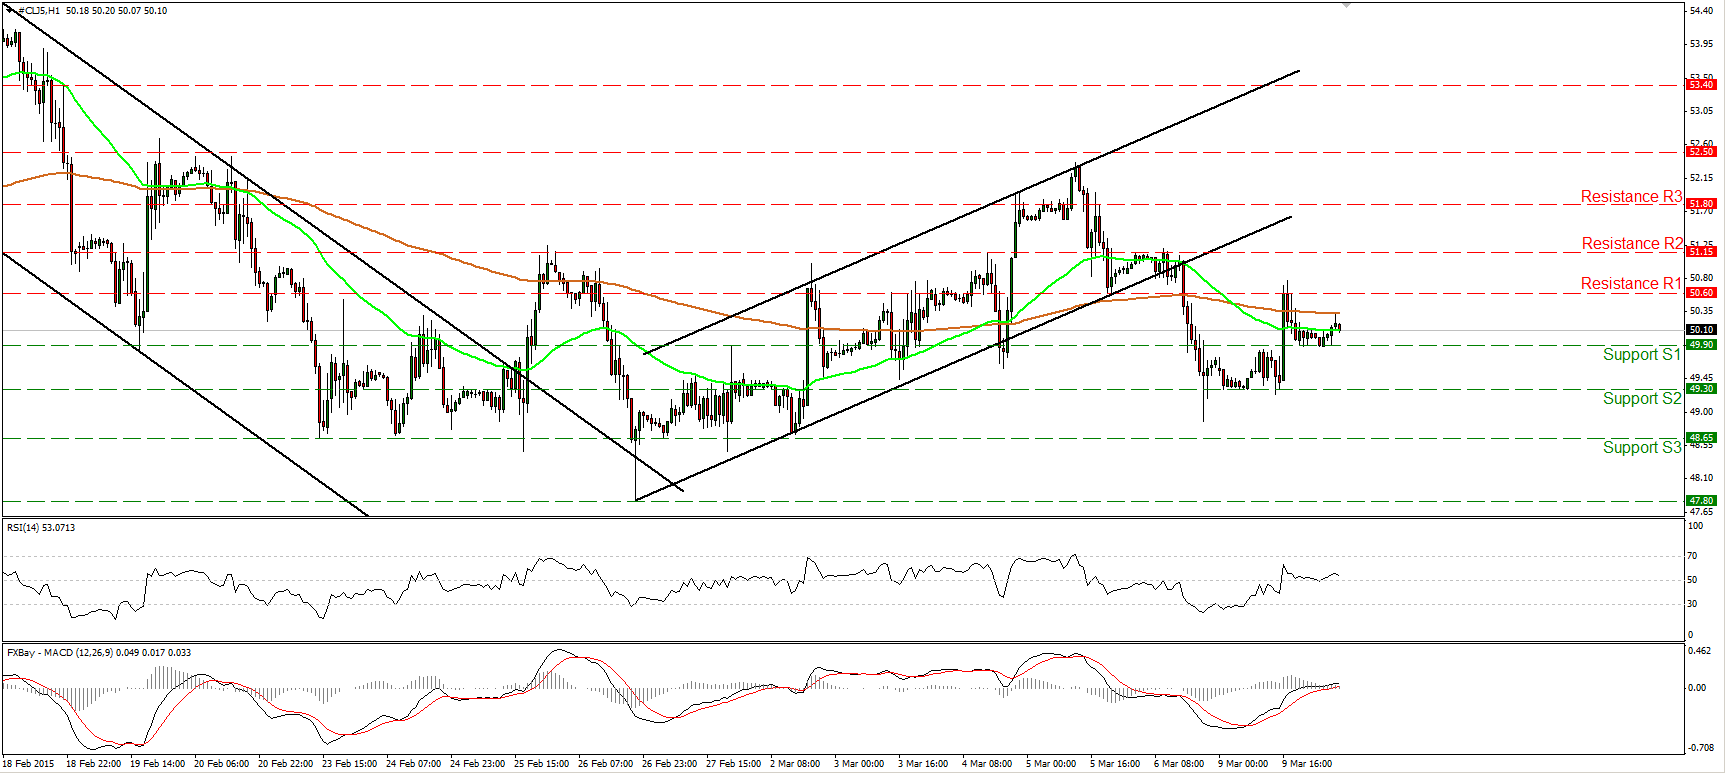
WTI surged on Monday, hit resistance slightly above our 50.60 (R1) line and slid to find support at 49.90 (S1). Both the 50- and the 200-hour moving averages point sideways, while both our short-term momentum indicators oscillate around their equilibrium lines. Taking these technical signs into account and also having in mind that I don’t see a clear trending structure on the 1-hour chart, I would prefer to stay neutral for now. On the daily chart, WTI is still trading below both the 50- and the 200-day moving averages. Nevertheless, it managed to print a higher low on the 26th of February. For now, I would prefer to sit on the side lines as far as the overall picture is concerned as well.
• Support: 49.90 (S1), 49.30 (S2), 48.65 (S3).
• Resistance: 50.60 (R1) 51.15 (R2), 51.80 (R3).

