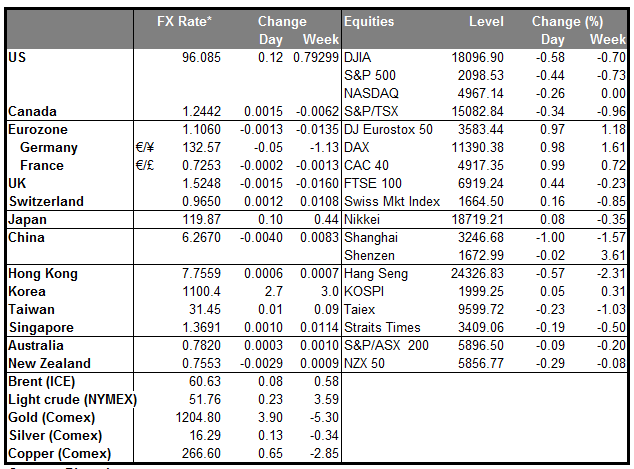
EUR weakens ahead of European Central Bank meeting The notable feature of the market yesterday was the euro’s weakness ahead of the ECB meeting today. This suggests to me that the FX market hasn’t yet factored in the full impact of QE, despite the fact that bond yields in the Eurozone have fallen to absurd levels as investors front-run the ECB. Last year, ECB days were the big days for EUR/USD – the average range for the pair on the days the ECB met was 0.97%, almost double the 0.57% average daily range for the year as a whole. Most other currencies saw little if any increased volatility (vs USD) on ECB days (except for CHF of course, as it was effectively pegged to EUR). However, for at least the next few months I don’t expect any change in ECB policy and hence I see no reason for any dramatic moves in the currency on ECB days. The ECB is unlikely to expand its QE program until it’s had a chance to judge the program’s success. Nor are they likely to express second thoughts on the program or reduce it until inflation is back up near their target. Thus yesterday’s move suggests a vote of confidence that the ECB’s QE program will at least succeed through weakening the currency. EUR could weaken further today as the ECB is likely to reiterate its pledge to keep QE in place until it has proved successful in raising inflation back to target. Moreover, there’s also the question of whom they’re going to buy the bonds from: probably foreigners, who will then repatriate their money (see below).
CAD strengthens on Bank of Canada statement The Bank of Canada kept interest rates on hold, as expected, but the tone of the statement was less dovish than anticipated. The Bank said that the risks around the inflation profile are now more balanced and that the current degree of monetary policy stimulus is still appropriate, hinting that they could avoid cutting interest rates at the next meeting as well. USD/CAD collapsed at the release but recovered to trade around the support line of 1.2430. The rate is still within a triangle formation and above the key support barrier of 1.2370. In our view, a strong NFP print on Friday is likely to erase Wednesday’s losses and perhaps drive the pair again above 1.2500.
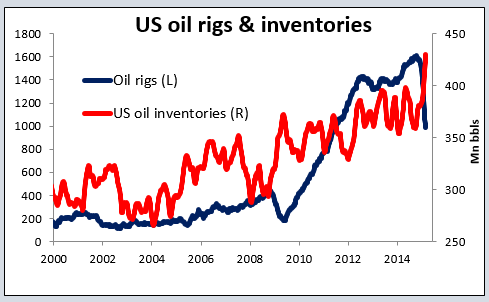
A mixed market in oil WTI rose yesterday, the third consecutive day of gains, on news that inventories rose only 536,000 barrels in the latest reporting week, vs growth of more than 1mn barrels so far each week this year. The slowdown indicates that US supply is starting to respond to the lower oil prices. In contrast, Brent was down slightly as Saudi Arabia reiterated its pledge not to cut production. Given the difference in the response between profit-driven US producers and less profit-sensitive Middle Eastern producers, we could see the gap between WTI and Brent narrow further.
What will be the main questions for the ECB today? There will be two main issues today. First, the market will be looking for clarification about the ECB’s quantitative easing program, which is to start this month. Secondly, there will be some interest in the revised economic forecasts, particularly the first forecasts for 2017. Some of the issues we hope to have clarified are:
- When exactly will they start buying bonds from the market?
- How will they coordinate the purchases, which are supposed to be carried out by the national central banks and not the ECB directly?
- They said they will buy EUR 60bn in public and private debt. What are the targets for public sector vs private sector bonds each month? Will they be willing to buy bonds with negative yields to achieve that target?
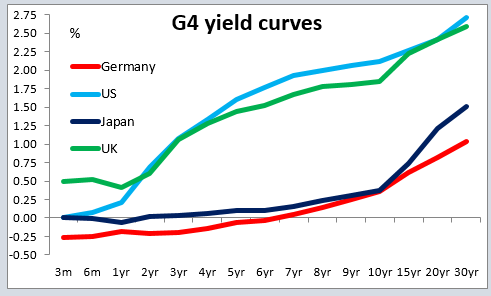
- Whom do they expect to buy the bonds from? About half of the Eurozone sovereign bond markets are held by European banks and financial institutions. They are not likely to sell, for the simple reason that they will have a hard time replacing the assets with anything offering a similar yield. In contrast, an estimated 36% of the bonds are held by foreigners, who may be more willing to take profits and invest the proceeds elsewhere (such as in Treasuries or Gilts). In that case, QE could be distinctly EUR-negative.
- What happens if they can’t find enough bonds to buy? Will they be willing for example to buy equities instead, as the Bank of Japan does?
- The ECB said the bond purchases will continue “until we see a sustained adjustment in the path of inflation…” What exactly does that mean? How big an adjustment, and how long does it have to be sustained?
- ECB Chief Economist Peter Praet recently said that the ECB “sees a turning point” in the Eurozone economy. Will they raise their forecasts as a result? The strength of the economy matters for the success of QE, because banks will only be willing to sell their bonds if they think they will be able to use the money to make loans. Therefore, the stronger the economy, the more successful QE is likely to be.
- The 2017 forecasts will be released at this meeting. What’s their expectation for inflation in 2017? Do they think they’ll be back to their target of “below, but close to, 2%” by then?
The Bank of England also meets to decide on its policy rate. There’s little chance of a change, hence the impact on the market should be minimal, as usual. The minutes of the meeting however should make interesting reading when they are released on 18th of March.
Today’s indicators: Germany’s factory orders fell by more than expected, -3.9% mom vs expectations of -1.0%. There was no impact on EUR/USD.
In Sweden, industrial production for January is expected to have slowed from the previous month. This could weaken SEK and drive USD/SEK up for a test at the 8.4000 resistance zone.
From the US, factory orders for January are expected to have risen 0.2% mom, a turnaround from -3.4% mom the previous month. After five consecutive month of drops, even a modest rise in factory orders could be an indication that the US growth has started regaining momentum in Q1 after cooling a bit in Q4, and consequently support the dollar.
Canada’s Ivey PMI for February is forecast to have risen, but still to stay below the 50 critical level.
Besides ECB President Draghi, we have speeches from Riksbank Governor Stefan Ingves and Norges Bank Governor Oeystein Olsen.
The Market
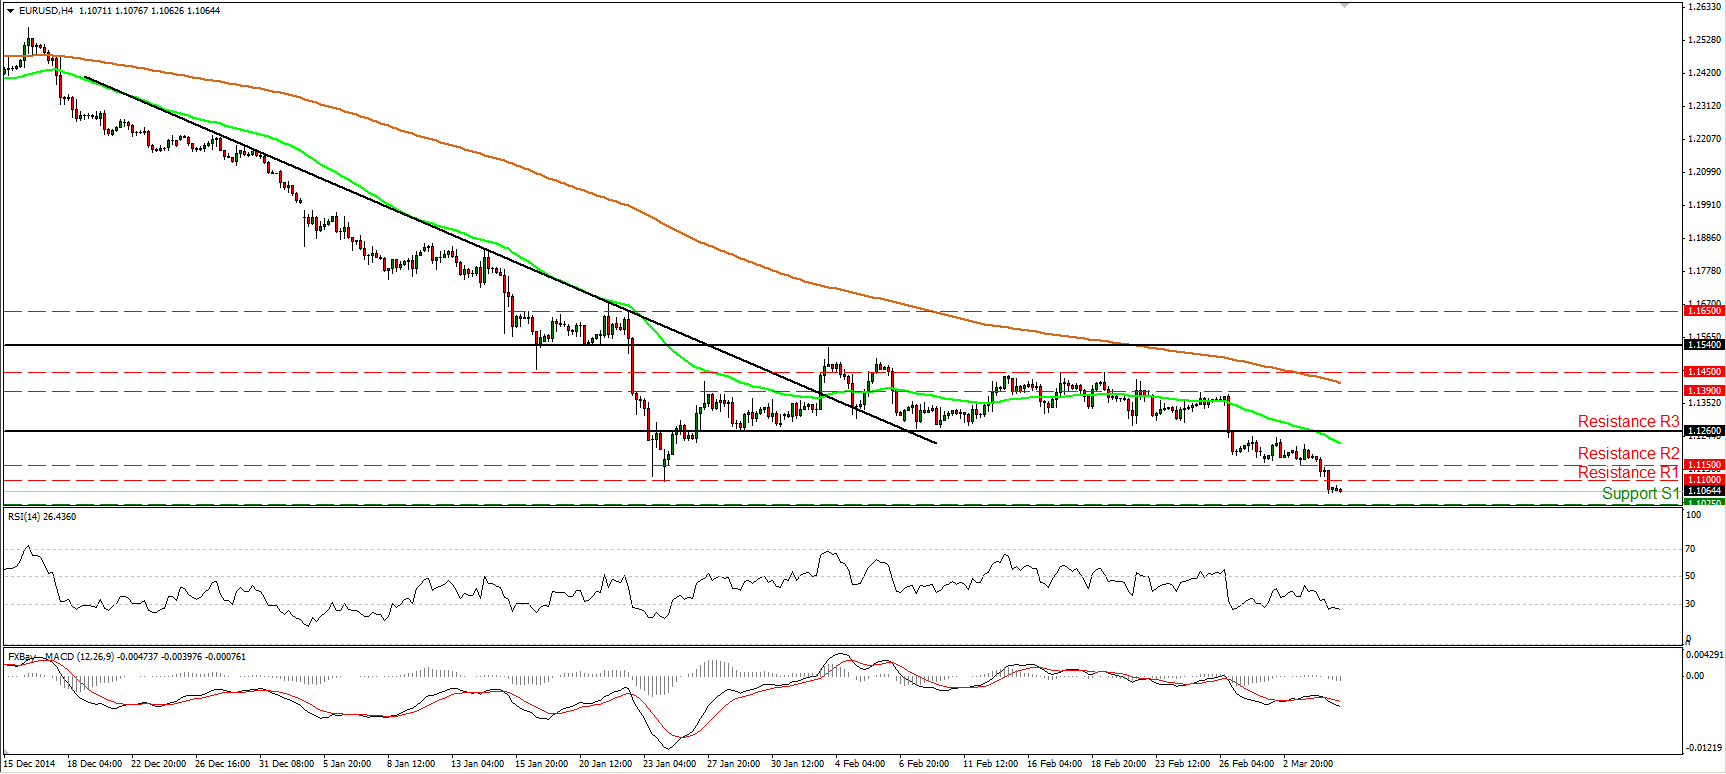
EUR/USD breaks below 1.1100 ahead of the ECB meeting
EUR/USD plunged yesterday, breaking below the key support (now turned into resistance) line of 1.1100 (R1). Today, the ECB meets and we are likely to get further details on the QE program, as well as the Bank’s new growth and inflation projections. The inflation projections will be important in giving guidance to the extent of the QE program, thus a downside revision could weigh on euro. The intraday bias remains negative and thus I would expect the dip below 1.1100 (R1) to set the stage for extensions towards our next support hurdle at 1.1025 (S1), defined by the high of the 1st of September 2003, or the psychological number of 1.1000 (S2). Our short-term technical oscillators detect accelerating downside speed and amplify the case for a lower EUR/USD. The RSI entered its oversold territory and is pointing down, while the MACD, already negative, fell below its trigger, and points south as well. With regards to the broader trend, I believe that the pair is still in a downtrend. EUR/USD is printing lower peaks and lower troughs below both the 50- and the 200-day moving averages. A clear close below the 1.1000 (S2) zone could signal larger bearish extensions and initially aim for the 1.0915 obstacle, marked by the low of the 5th of September 2003.
• Support: 1.1025 (S1), 1.1000 (S2), 1.0915 (S3).
• Resistance: 1.1100 (R1), 1.1150 (R2), 1.1260 (R3).
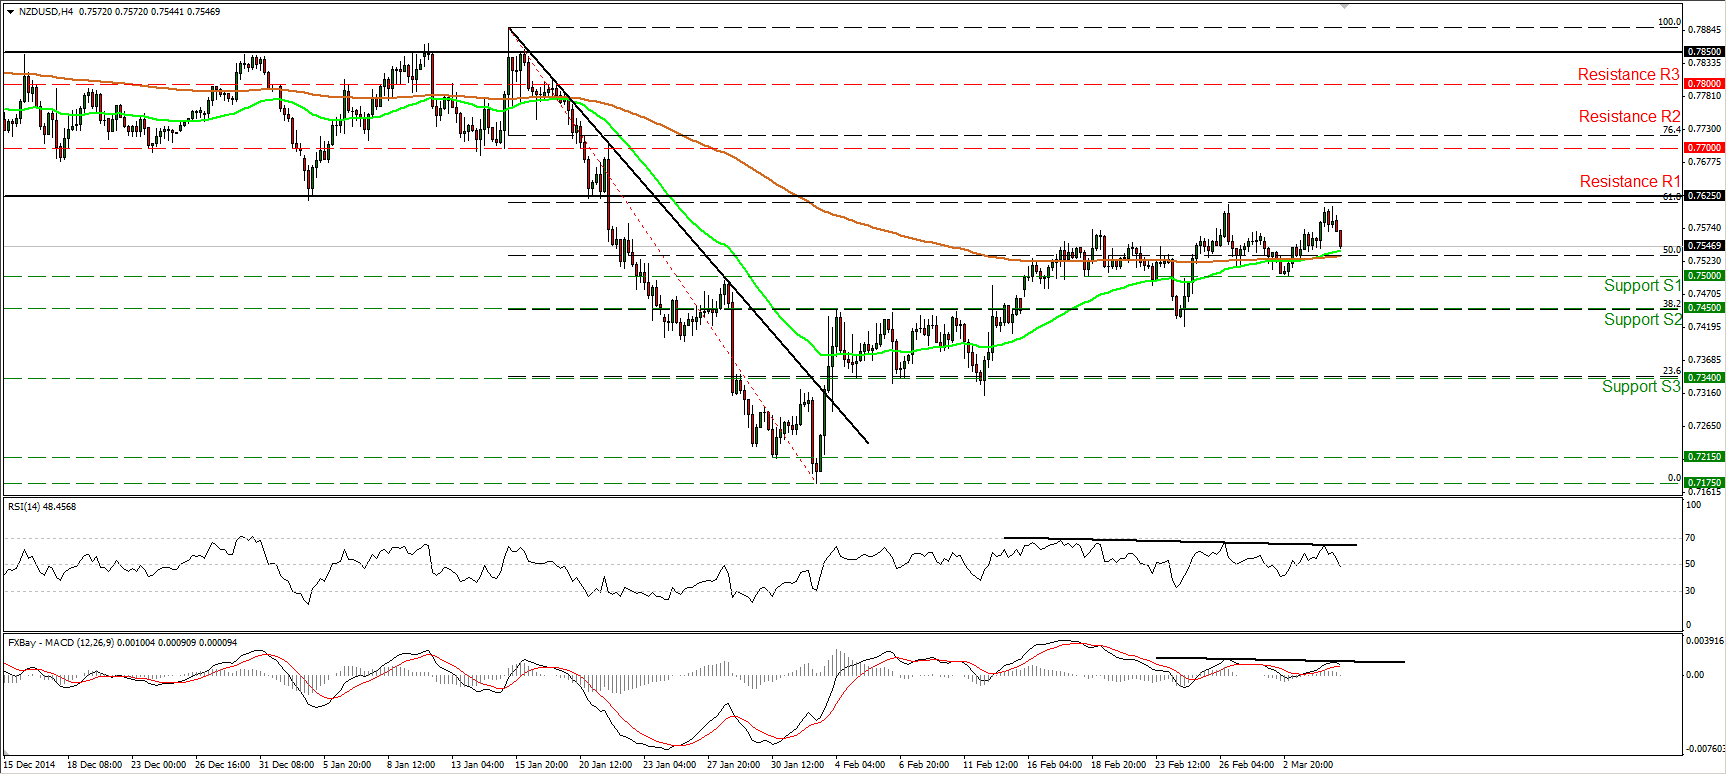
NZD/USD hits again resistance near the 0.7625 key line
NZD/USD hit resistance again near the 0.7625 (R1) barrier and retreated thereafter. Taking into account that there is still negative divergence between both our short-term oscillators and the price action, and that the rate failed to overcome the 0.7625 (R1) barrier twice, I would expect the decline to extend towards the key barrier of 0.7500 (S1). A clear move below the key 0.7500 (S1) line would signal the completion of a short-term double top formation and perhaps turn the short-term bias to the downside. Such a break is likely to challenge the next significant support area, at 0.7450 (S2). In the bigger picture, I still believe that the overall trend is negative. Consequently, I would treat the recovery from 0.7175 as a corrective phase, at least for now.
• Support: 0.7500 (S1), 0.7450 (S2), 0.7340 (S3).
• Resistance: 0.7625 (R1), 0.7700 (R2), 0.7800 (R3).
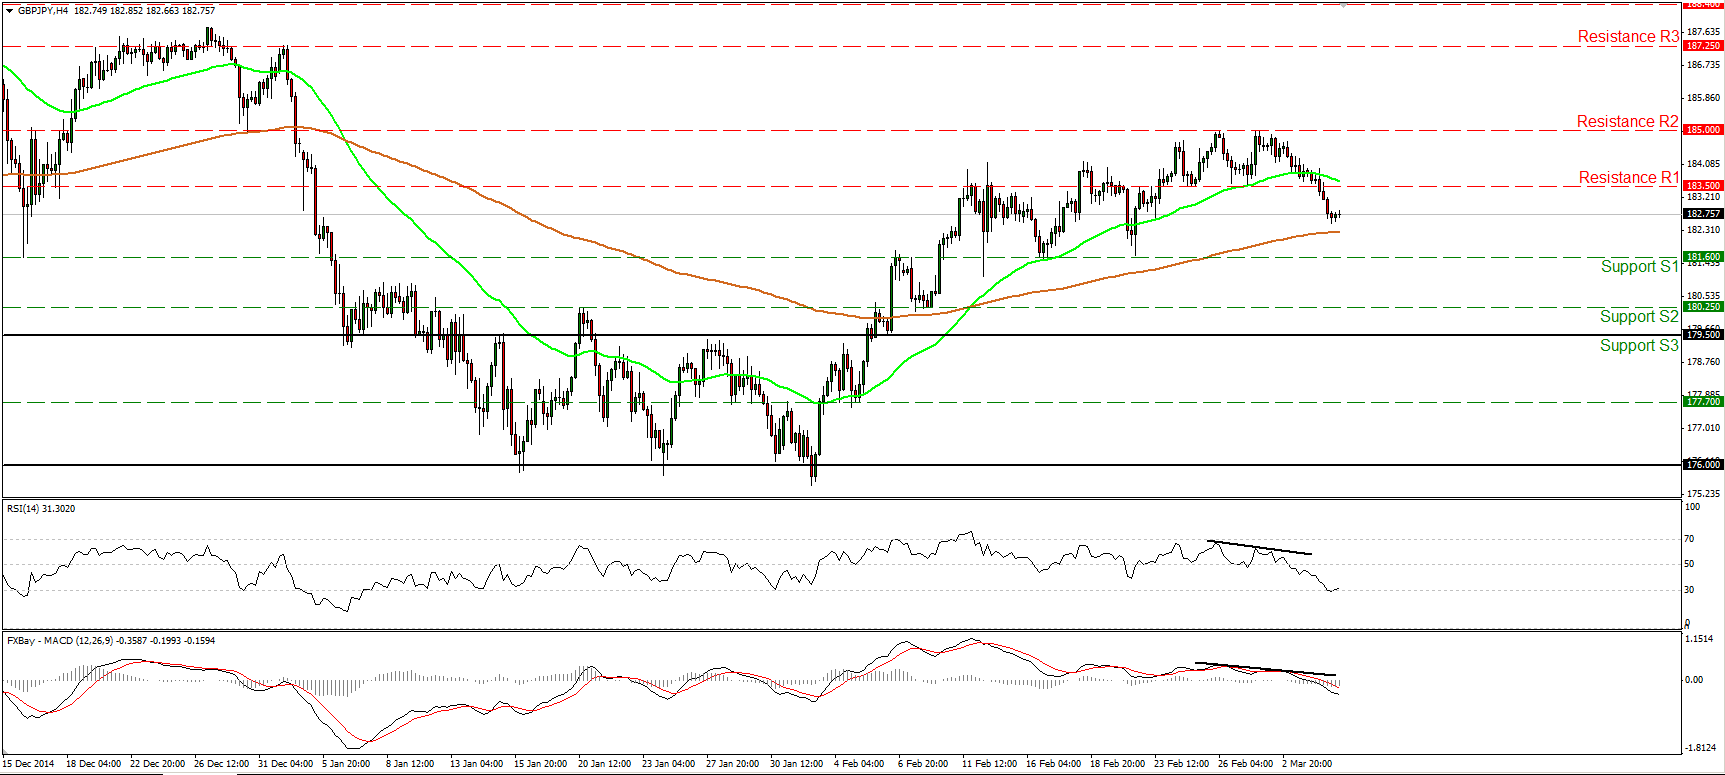
GBP/JPY falls below 183.50
GBP/JPY continued its tumble after failing to overcome the psychological figure of 185.00 (R2). The rate dipped below the support (turned into resistance) hurdle, confirming the negative divergence between our short-term oscillators and the price action, and also signaling a forthcoming lower low on the 4-hour chart. That shifts the near-term picture negative in my view, and magnifies the case that the rate could extend lower and perhaps challenge the support line of 181.60 (S1). I would stay careful for now though as a bounce could be looming, perhaps for a lower high around the 183.50 (R1) barrier. My worries are derived from the RSI, which hit support at its 30 line and is currently pointing somewhat up. On the daily chart, the rate is trading above both the 50- and the 200-day moving averages and this keeps the longer-term picture positive. Therefore, I would treat any possible near-term declines as a corrective move of the larger upside path.
• Support: 181.60 (S1), 180.25 (S2), 179.50 (S3).
• Resistance: 183.50 (R1), 185.00 (R2), 187.25 (R3).
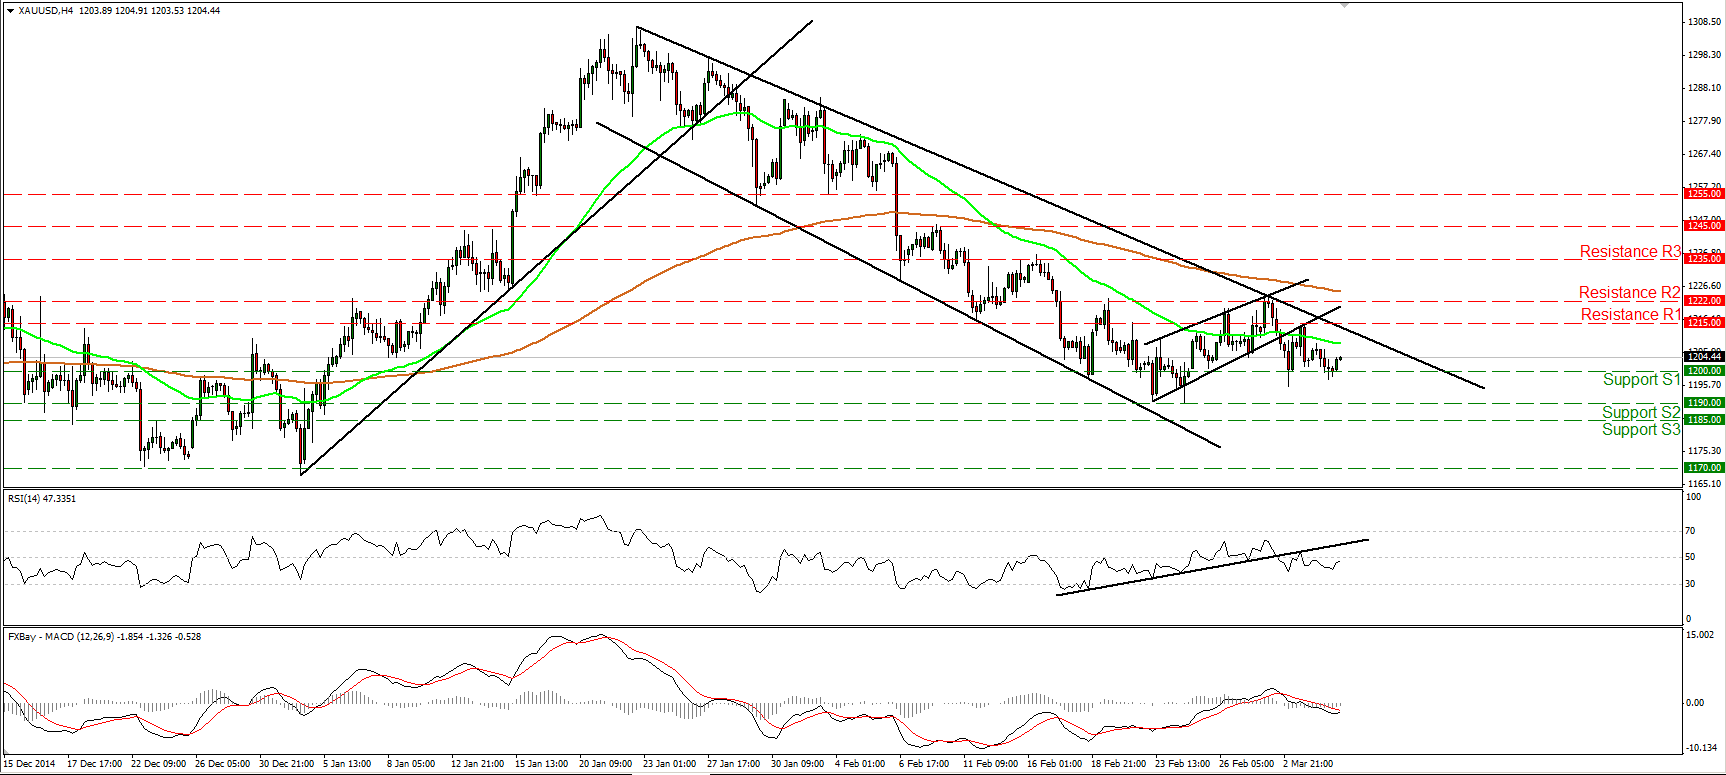
Gold pauses around 1200 again
Gold slid on Wednesday, but the decline was halted once again near the round figure of 1200 (S1) before rebounding somewhat. The fact that the yellow metal is trading below the lower line of the flag and below the black downtrend line taken from back the high of the 22nd of January keeps the near-term outlook negative, IMHO. Nevertheless, I would prefer to see a clear price close below the key number of 1200 (S1) before getting more confident that the metal would extend lower. Such a move could challenge again the support line of 1190 (S2). As for the bigger picture, a break below the 1190 (S2) zone is the move that would confirm a forthcoming lower low on the daily chart and perhaps signal the continuation of the fall from 1307.
• Support: 1200 (S1), 1190 (S2), 1185 (S3).
• Resistance: 1215 (R1), 1222 (R2), 1235 (R3).
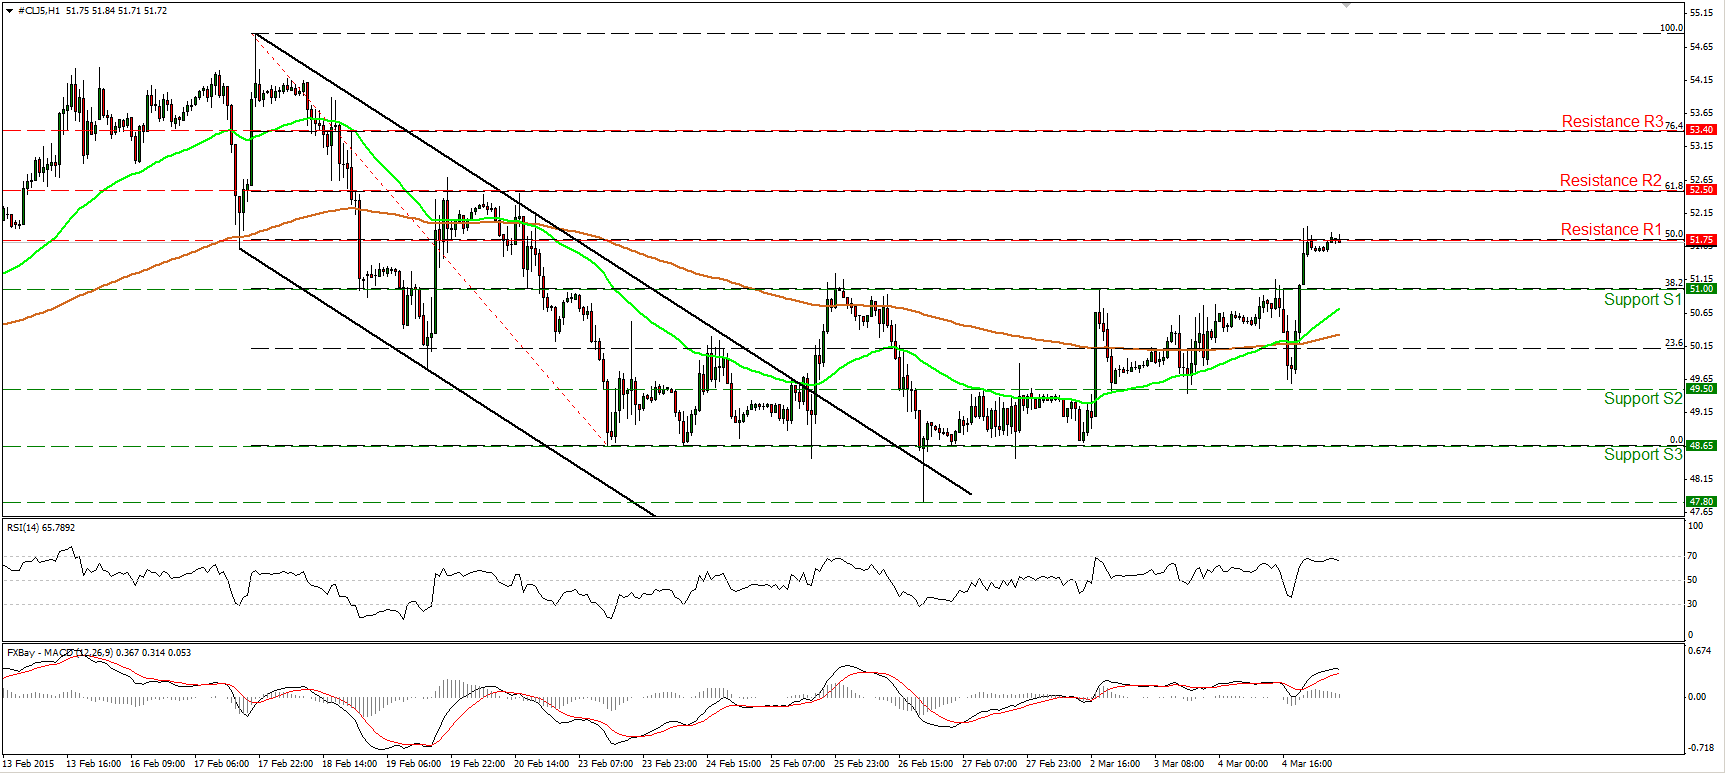
WTI shoots up and hits 51.75
WTI pulled back after hitting resistance again near the (now turned into support) 51.00 (S1) line, which happens to be the 38.2% retracement level of the 17th - 23rd of February decline. However, the pullback was halted marginally above 49.50 (S2) and WTI shot up to break above 51.00 (S1) and to reach the resistance hurdle of 51.75(R1), the 50% retracement level of the aforementioned decline. Taking a look at our momentum studies, I believe that we are likely to see another pullback, perhaps to test the 51.00 (S1) area as a support this time. The RSI found resistance near its 70 line and turned down, while the MACD shows signs of topping and could move below its trigger line soon. On the daily chart, WTI is still trading below both the 50- and the 200-day moving averages. Nevertheless, it managed to print a higher low on the 26th of February. A break above the 55.00 psychological zone is the move that would signal a forthcoming higher high and perhaps bring a trend reversal. For now, I would prefer to sit on the side lines as far as the overall picture is concerned.
• Support: 51.00 (S1), 49.50 (S2), 48.65 (S3).
• Resistance: 51.75 (R1) 52.50 (R2), 53.40 (R3) .

