The clash Greece and Germany seem headed for a collision course today as both sides have dug in their positions ahead of a meeting of eurozone finance ministers today. Greek PM Tsipras said there is “no way back” for the country and that he wants a new agreement with official creditors. On top of that, the Greek defense minister upped the ante by saying that if Greece failed to get a new debt agreement with the eurozone, it could always look to Russia or China for help. But German Finance Minister Schaeuble said there are no plans to discuss a new accord or to give the country more time. He said “it’s over” if Greece doesn’t want the final tranche of the current aid program, which of course comes with the existing requirements for austerity and structural reform. Greek markets were encouraged yesterday after some news reports about a possible compromise; the Athens stock market was up 8%, while Greek bank stocks rallied around 15%. EUR/USD has been surprisingly stable (opened with a 1.13 handle for the last three mornings) but this could be coming to an end as we come down to the wire in the negotiations.
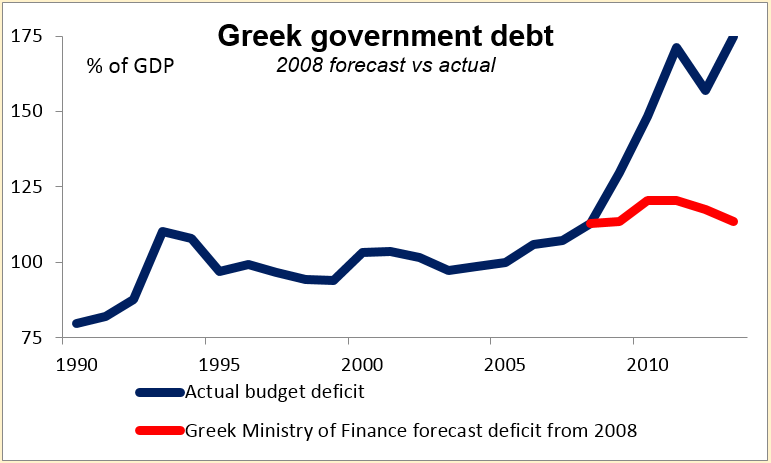
One pundit summed up the Greek issue as follows: “Because the Greeks agreed as a condition of their bailout to do something that is impossible – to pay off their debt – the rest of the eurozone (led by Germany) actually wants them to continue to commit to doing the impossible in order that they might be given even more money, so that their debt, which they can’t possibly pay, can rise even further…The rest of Europe seems to be just fine with Greece’s going further into debt that it can’t pay, as long as they at least promise to pay it. The fact that their doing so will mean a permanent depression in Greece doesn’t really rank very high on their lists of concerns.” As the graph shows, the governments’ debt has ballooned to over 170% of GDP, far above what was expected when the country’s problems first came to light. A country whose economy is still contracting in nominal terms cannot possibly repay such a debt and there is no hope for it to continue financing itself when 10-year rates are 10.2%.
Still, Germany cannot give in, because if it does, then Spain and Portugal are sure to follow, and that would be politically murderous. Indeed, the Spanish government has also been against any compromise, as it believes that would only empower the opposition Podemos Party. The economics are clear: Greece cannot pay its debts and needs to have them reduced. However, the eurozone has always been a political project, not an economic one, and German politics rule against any debt write-offs. Thus we are indeed headed for a collision course. I still believe that a compromise will be reached, but as usual for Europe, only at the last minute and only under pressure from the markets. That pressure is likely to appear in the FX market as a weaker euro.
I should add though that this is not the unanimous opinion of the research team here. Others feel that Greece is in such a bad condition already (25% official unemployment, worse than the US at the depths of the Depression) that the government may feel it has nothing to lose by leaving the eurozone. Indeed, one possible explanation for the recent stability of EUR/USD is that some investors may think that a “Grexit” would be beneficial for the euro as the group would get rid of its weakest member. That may be so in the long run, but I doubt if it would be beneficial in the short run. The big risk is that other countries follow and the euro breaks up. Between 1919 and 2007, 181 countries left currency unions or the gold standard; of these, 124 took place in the same year or year after another country left in the same region. In other words, when one country leaves, others tend to follow. The market would price in this uncertainty if Greece left, meaning a weaker euro, in my view.
The schedule for Greece is as follows:
Today: eurozone finance ministers (eurogroup) meets to discuss further aid to Greece.
Thur & Fri: EU summit. Russia & Ukraine will be high on the agenda as well as Greece.
16/17 Feb: eurogroup meets again; Greece needs to submit a bail-out extension request by then. This may be the decisive meeting.
18/19 Feb: ECB bi-weekly review of emergency liquidity assistance (ELA) for Greece.
28 Feb: Bail-out ends. Greece is on its own financially if no agreement is reached.
Fed talk remains hawkish Two Fed officials made quite hawkish comments yesterday, which may have contributed to the dollar’s general rise against most G10 currencies (except NOK and SEK). Richmond Fed President Lacker said the recent US data have “solidified” his view that the Fed should raise rates in June. “The data between now and then may change my mind, but it would have to be surprising data,” he said. Note however that Lacker does not vote on the FOMC. However, his comments were echoed by San Francisco Fed President Williams, who said in the FT that economic conditions are "getting closer and closer to those where it makes sense to start thinking seriously about the starting this process of normalization.” Fed funds rate expectations continued to rise, again the opposite of what is happening in most other countries. This monetary policy divergence should continue to support a stronger dollar.
Australia’s home loans rose more than expected in December and consumer confidence also rose. Yet the AUD didn’t benefit from the news. In fact all the commodity currencies were weaker as oil plunged on comments yesterday from the International Energy Agency (IEA) in Paris that excess supply will persist to the middle of this year. CAD was the worst performing G10 currency as Bank of Canada Gov. Poloz argued that the CAD was falling not because he is talking down the currency, but because the economy is deteriorating.
Today’s highlights: Norway’s Q4 GDP is expected to rise a bit from the previous quarter. On top of the better-than-expected inflation rate on Tuesday, this may take off some pressure from the Norges Bank to cut rates in its March meeting. This could prove NOK-supportive.
In Sweden, PES unemployment rate for January is expected to rise a bit, in line with the estimated rise in the official unemployment rate on Thursday.
As for the speakers, beyond the eurozone finance ministers, ECB Executive board member Benoit Coeure and Dallas Fed President Richard Fisher speak. Benoit Coeure said recently that debt cancellation is a political decision and the ECB cannot agree on any debt relief involving bonds held by the ECB as this is legally impossible.
The Market
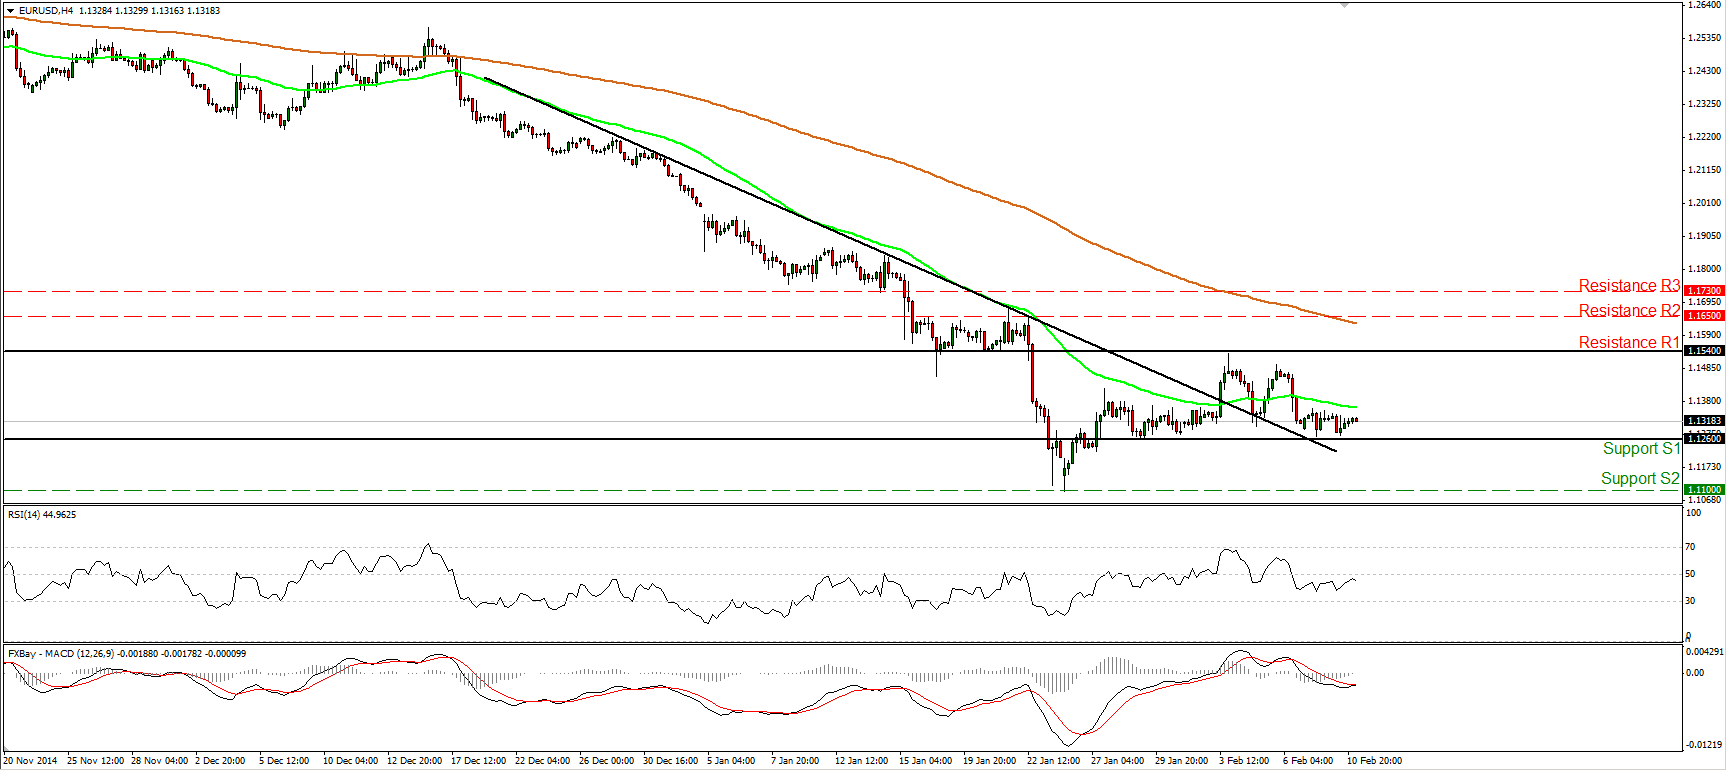
EUR/USD stays near the 1.1260 line
EUR/USD slid somewhat on Tuesday, found support once again fractionally close to the 1.1260 (S1) line and rebounded to trade virtually unchanged for a second consecutive day. The rate has been trading between the aforementioned support line and the resistance obstacle of 1.1540 (R1) since the 27th of January and therefore I would hold the view that the near-term picture of EUR/USD stays neutral. As far as the broader trend is concerned, the price structure still suggests a longer-term downtrend. EUR/USD is printing lower peaks and lower troughs below both the 50- and the 200-day moving averages. I still consider the recovery from 1.1100 (S2) as a corrective phase and I would expect the bears to eventually take control again.
• Support: 1.1260 (S1), 1.1100 (S2), 1.1020 (S3).
• Resistance: 1.1540 (R1), 1.1650 (R2), 1.1730 (R3).
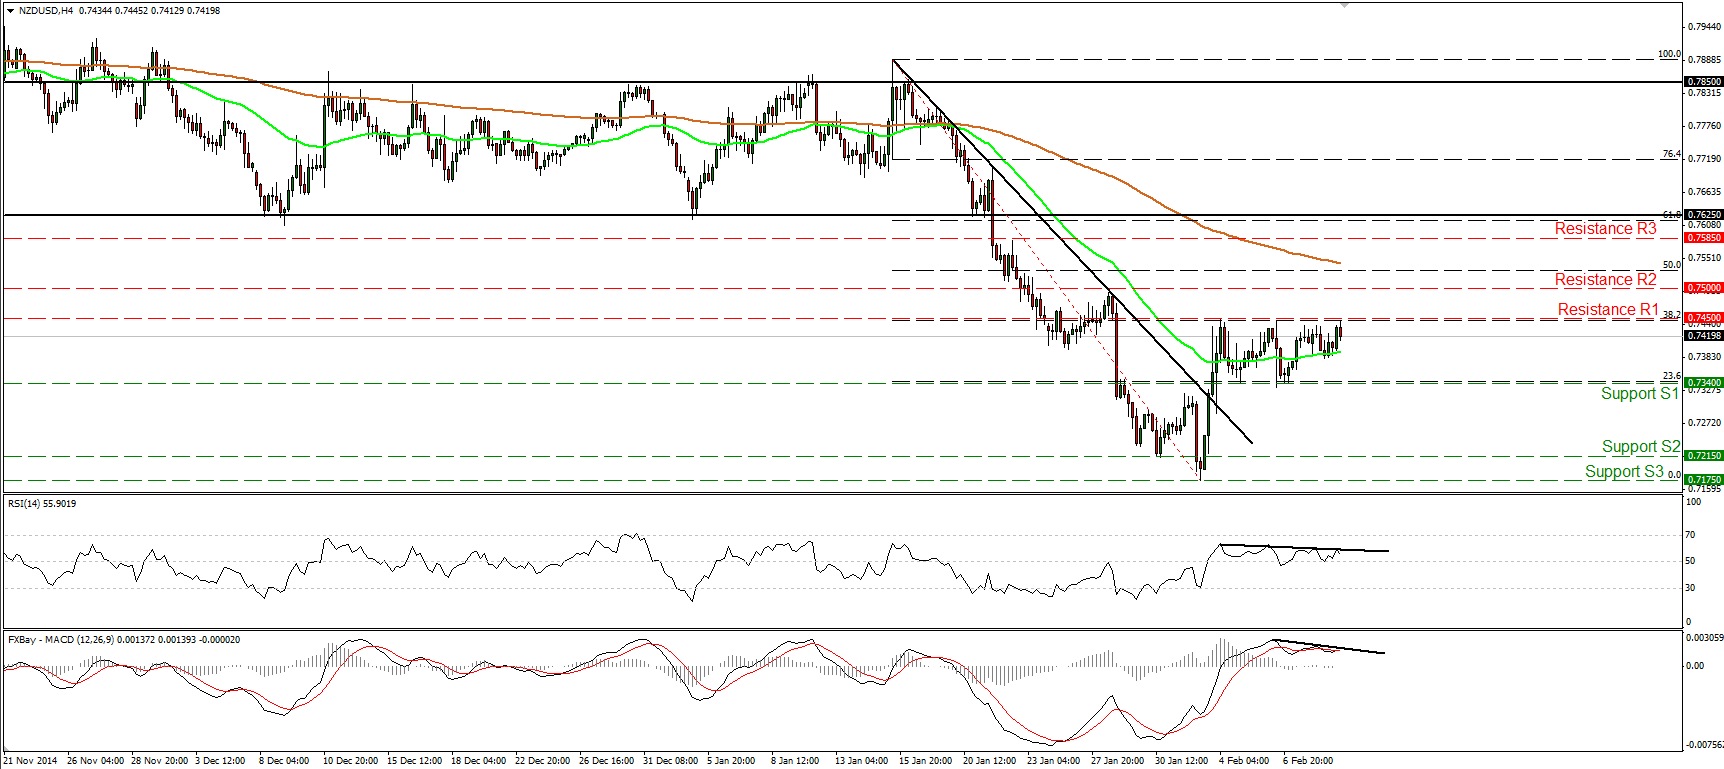
NZD/USD hits resistance at 0.7450 again
NZD/USD rose slightly yesterday but the advance was halted again by the 0.7450 (R1) hurdle, which lies fractionally close to the 38.2% retracement level of the 15th of January – 3rd of February down move. Given the inability of the longs to drive the battle above that area, and given the negative divergence between both our short-term oscillators and the price action, I would expect the forthcoming wave to be negative. Perhaps for another test at the 0.7340 (S1) support. A dip below that level could prompt extensions towards the next barrier, at 0.7215 (S2). On the daily chart, the break below 0.7625, the lower bound of the sideways range containing the price action from the beginning of December until the 21st of January, signaled the continuation of the longer-term downtrend and turned the overall outlook of the pair back negative. Therefore, I would treat the recovery from 0.7175 (S3) as a corrective phase before sellers take control again.
• Support: 0.7340 (S1), 0.7215 (S2), 0.7175 (S3).
• Resistance: 0.7450 (R1), 0.7500 (R2), 0.7585 (R3).
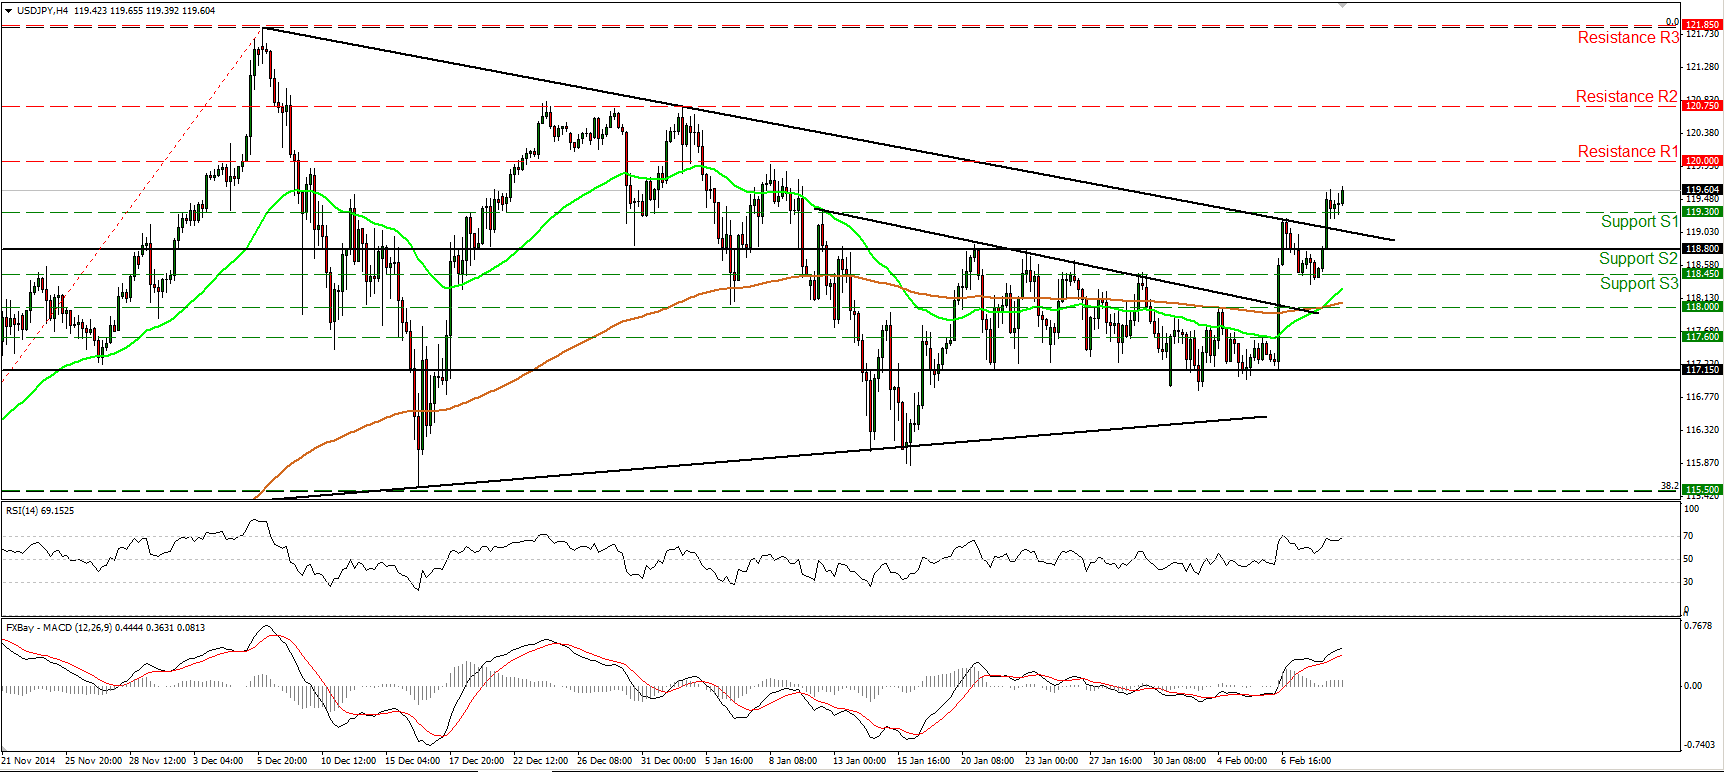
USD/JPY breaks the upper bound of the triangle
USD/JPY shot up again after finding solid support near the 118.45 (S3) barrier. The rate broke above the upper bound of a triangle pattern that had been containing the price action since November, and above the 119.30 (S1) resistance (now turned into support). I would now expect a test near the psychological number of 120.00 (R1). On the daily chart, the rate is still trading above both the 50- and the 200-day moving averages and above the upper line of the aforementioned triangle. However, I would need to see a clear break above the round figure of 120.00 (R1) to convince me that the pair is resuming the longer-term uptrend.
• Support: 119.30 (S1), 118.80 (S2), 118.45 (S3).
• Resistance: 120.00 (R1), 120.75 (R2), 121.85 (R3).
Gold trades somewhat lower
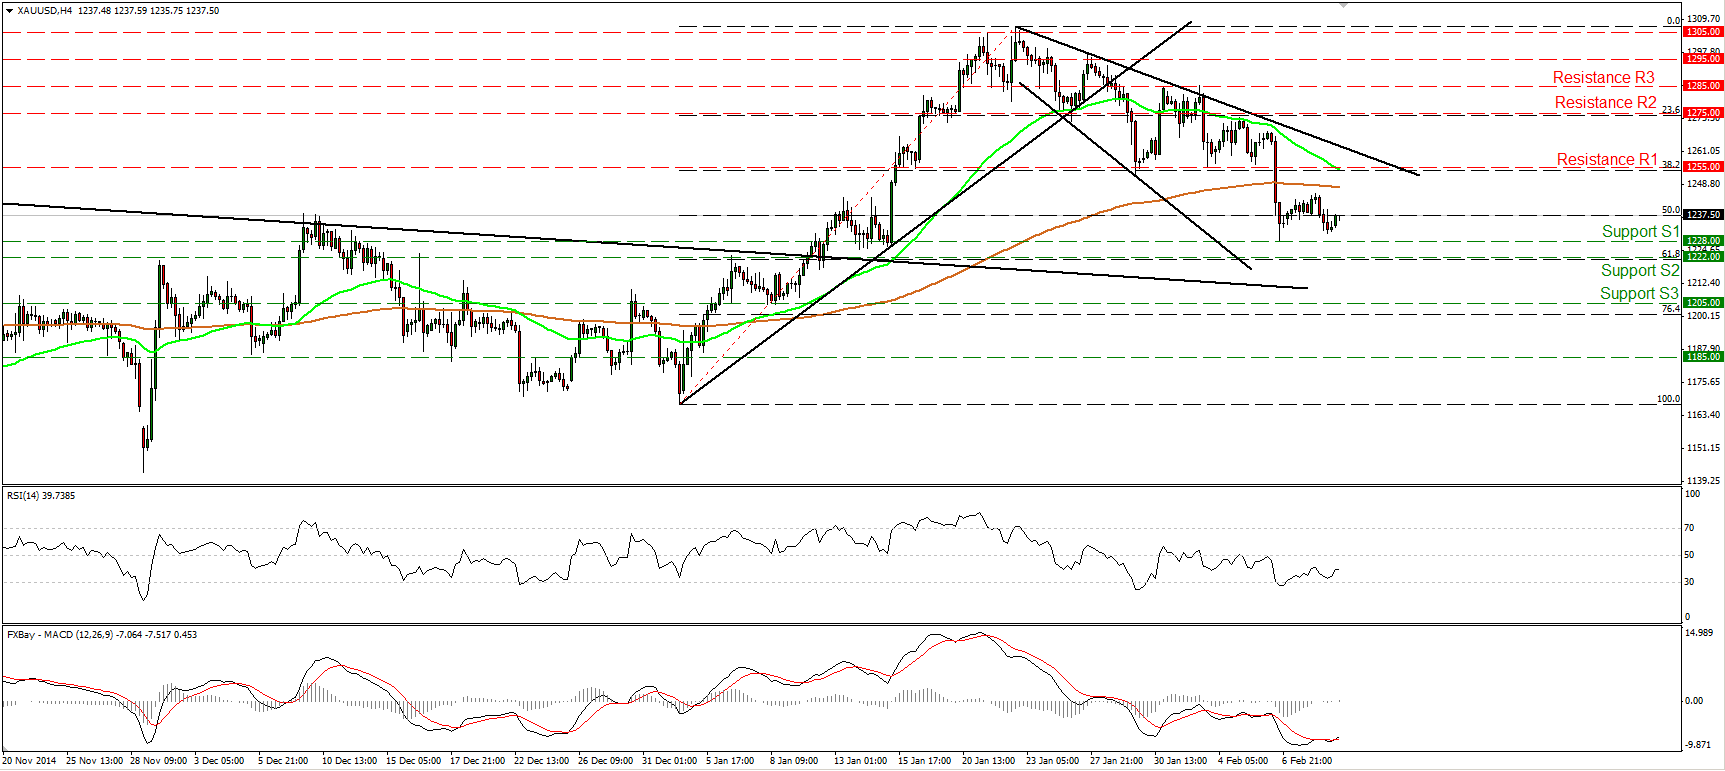
Gold declined somewhat on Tuesday but stayed above the 1228 (S1) support line. The technical picture is once again little changed. After Friday’s fall, the short-term picture of the precious metal stays negative, and we may see the bears testing the 1222 (S2) barrier in the near future. Note that the 1222 (S2) line lies marginally close to the 61.8% retracement level of the 2nd – 22nd of January advance. As for the bigger picture, on the daily chart the possibility for a higher low still exists and thus I would still treat the decline from 1305 as a corrective phase, at least for now.
• Support: 1228 (S1), 1222 (S2), 1205 (S3).
• Resistance: 1255 (R1), 1275 (R2), 1285 (R3).
WTI tumbles near 50.00
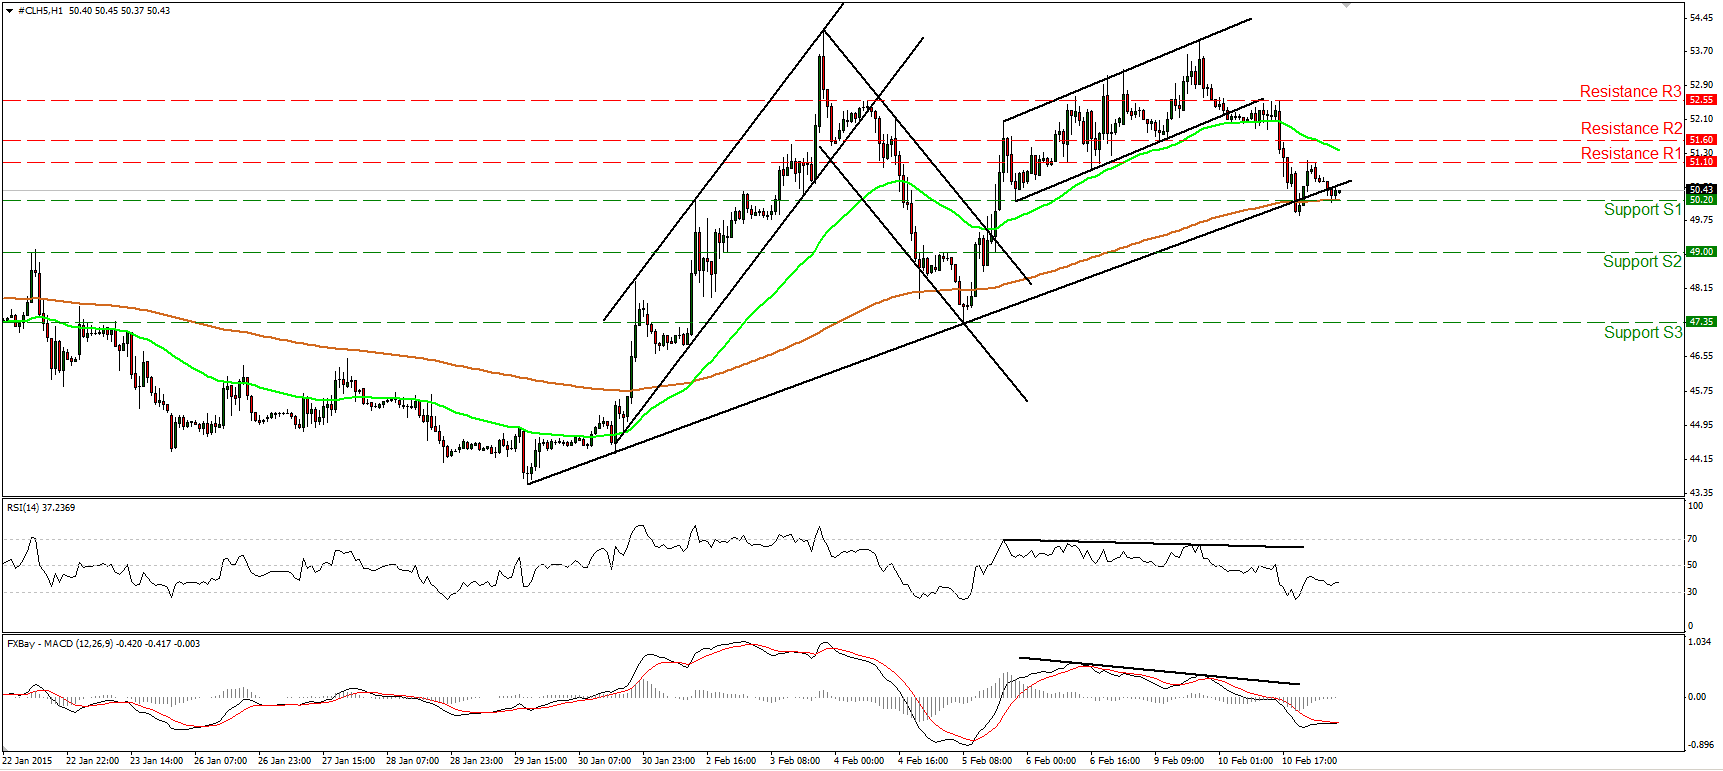
WTI tumbled after breaking below the lower bound of a minor-term upside channel and below the 50-period moving average. Crude oil is now trading near the support area of 50.20 (S1), which currently coincides with the 200-period moving average. A dip below that support territory is likely to set the stage for extensions towards the 49.00 (S2) hurdle in my view. On the daily chart, WTI is still trading below both the 50- and the 200-day moving averages, but given the positive divergence between the daily oscillators and the price action, I would prefer to stay to the sidelines as far as the overall picture is concerned.
• Support: 50.20 (S1), 49.00 (S2), 47.35 (S3).
• Resistance: 51.10 (R1) 51.60 (R2), 52.55 (R3).

