The Big Picture
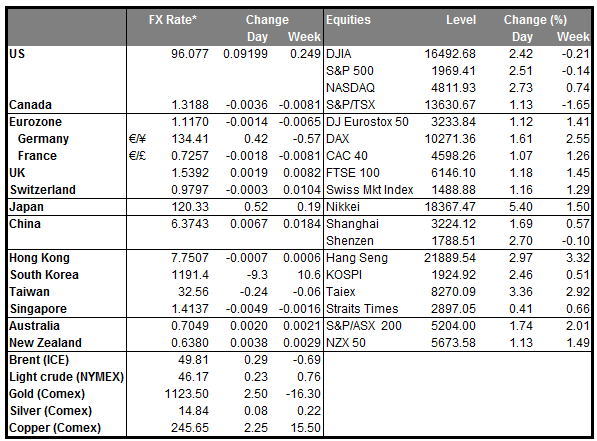
• Risk comes back into fashion The relief rally that I had expected on Monday actually took place on Tuesday, as European stocks closed higher, US investors continued the rally, and Asia continued the party, with Japanese stocks up 5% this morning. Despite yesterday’s announcement of disappointing Chinese trade data, commodity prices soared – copper for example was up 5.1% and WTI up 4.4%. Naturally the commodity and oil-related currencies rose, such as NZD, AUD, CAD, ZAR, RUB and MXN. GBP was in there too, perhaps because of merger-related flows. On the other hand, the safe-haven JPY and CHF took the biggest hit.
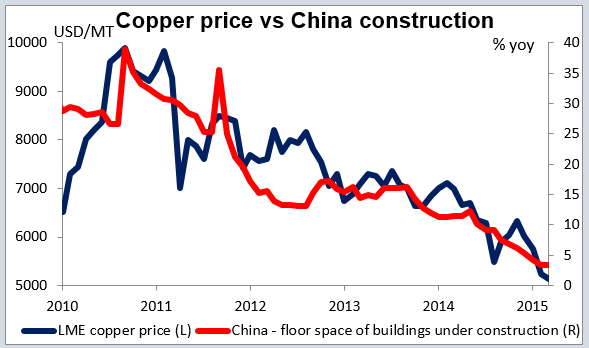
• Copper, often seen as a tradable proxy for Chinese growth, gained after China’s imports of copper ore and concentrate jumped 19% mom in August. The head of Rio Tinto (LONDON:RIO) Group’s copper and coal operations said signs of improvement in the Chinese property market were boosting the prospects for the metal and that he has “confidence there’s demand for our product” in China. Also, Glencore (LONDON:GLEN) became the third major copper producer to announce mine closures, thereby bringing supply more in line with demand. I believe the price is limited in the long run, as there is more new capacity coming onstream next year, but that is several months down the road.
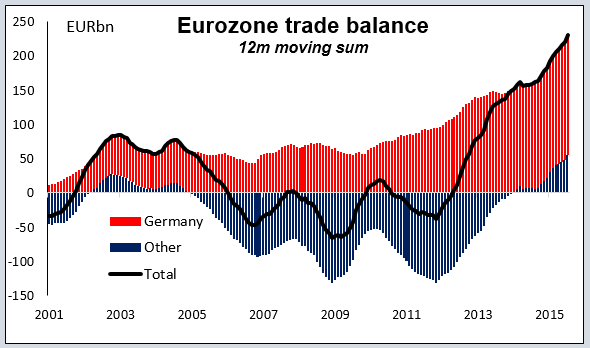
• Germany hits record trade surplus: While attention yesterday focused on the Chinese trade figures, Germany’s trade surplus hit a record high of EUR 25.0bn, and for much better reasons than China’s booming trade surplus: strong exports (+2.4% mom vs +2.2% mom for imports). That’s quite surprising given the weakness of global trade as a whole, and is a testament to German companies’ ability to dominate their market niches. The country’s current account surplus is enough to push the Eurozone as a whole well into surplus too. One question must be, how will Germany use this surplus? It’s likely that their taste for lending money abroad has been dented by the Greek crisis and the weakness of EM economies. Another possibility is that they lend it at home: maybe we can expect a real estate boom in Germany? However, if Germany fails to recycle the money abroad or invest it at home, then by definition either their current account surplus would fall or the euro would strengthen, or perhaps the current account surplus would fall because the euro strengthens. That’s perhaps the major risk to my forecast of a lower euro, aside from a risk-off environment that causes investors to close out short EUR positions.
• The Mummy walks again: Like the dead risen from the grave in an old horror story, we are starting to hear talk of another US government shut-down! To keep the government running, Congress has to pass 12 separate spending bills for various agencies and programs and get them all signed by the president by Sep. 30th each year. In fact, Congress has failed to do so for the last 18 years. Instead, they have passed a series of temporary funding measures — called "continuing resolutions" — and then wrapped most of the funding into a single "omnibus" spending package. Congress failed to accomplish even this in 2013, and most of the government had to shut down for two weeks as a result. This year, the House has passed a handful of spending bills that President Obama has threatened to veto for various reasons, while the Senate has passed none. The reason is that the Republican Party is trying to use the issue to force the government to stop funding Planned Parenthood, a private organization that focuses on women’s health issues, including abortions. Several of the Republican candidates for President (there are an estimated 18 of them) are trying to use this issue to raise their popularity with voters who oppose abortion, so it may be difficult for Republican Party officials to stop them. Given the difficulties that these candidates are having in distinguishing themselves in such a crowded pack, they may be willing to take more and more extreme positions. It could be dangerous!
• Today’s highlights: During the European day, the highlight will be the Bank of Canada rate decision. At its last meeting, the Bank reduced its growth forecasts sharply and cut rates by 25bps. It also left the door open for further rate cuts, as it said that the depressed outlook for Canada’s growth has increased the downside risks to inflation. Even though Canada’s CPI accelerated in July and GDP, trade and employment data were all surprisingly improved, Canadian oil prices are much lower than where they were in July and lumber prices are down 19%. As such, we don’t expect any action at this meeting, but we expect the Bank to reiterate its dovish stance and keep alive the scenario for further cuts in the foreseeable future. That could leave CAD vulnerable. As for indicators, the country’s housing starts for August and building permits for July are also coming out.
• From the UK, we get industrial production for July. The manufacturing PMI increased somewhat in July, but both the construction and service-sector indices declined, driving the composite PMI lower. Industrial production is expected to rise in July, a turnaround from the month before, which could strengthen GBP. However, the disappointing PMI figures for July increase the likelihood for another slump. In such case, GBP is likely to come under renewed selling pressure. The UK trade balance for July is also coming out.
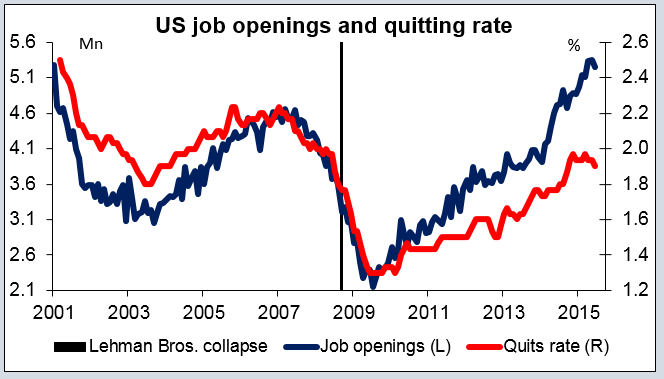
• In the US, only data of secondary importance are coming out. The Job Opening and Labor Turnover Survey (JOLTS) report for July is due out and the forecast is for a moderate increase in the number of job openings. This survey will also bring the “quit rate,” a closely watched indicator of how strong the job market is.
• The Reserve Bank of New Zealand will hold its policy meeting at the end of the European day. As we said on Monday, expectations are for a 25bps rate cut, which could put further downward pressure on NZD. See Monday’s comment for more details.
• Minneapolis Fed President Narayana Kocherlakota and RBA Deputy Governor Philip Lowe spoke overnight. Today, ECB Executive Board member Peter Praet will participate in a discussion on “Mitigating the impacts of lasting low interest rates for the financial sector” at the Eurofi Financial Forum.
The Market
EUR/USD in a sideways path
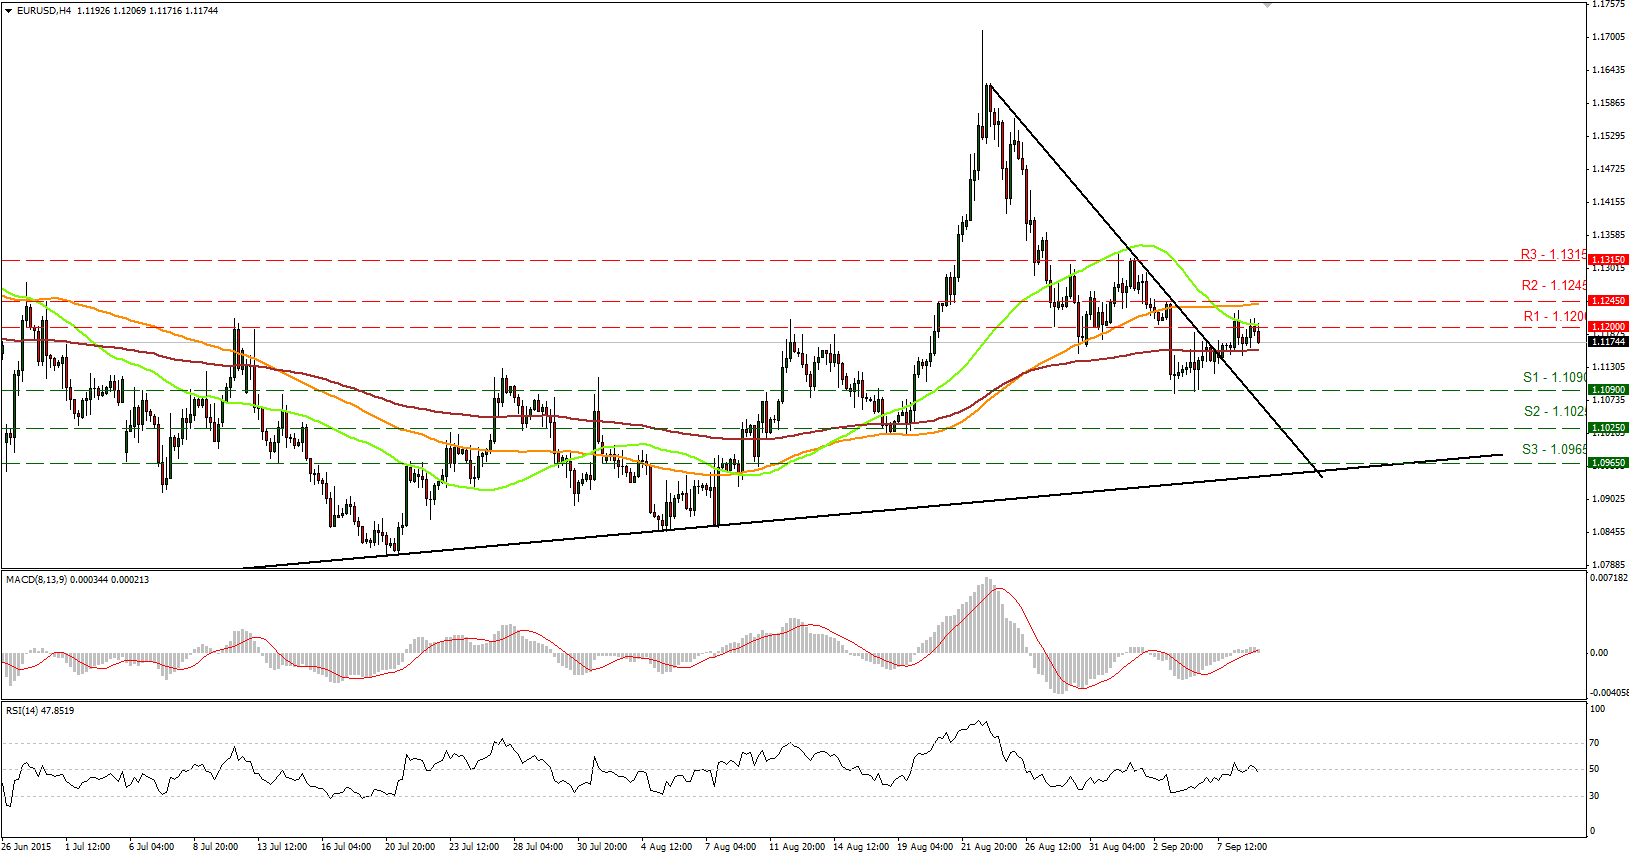
• EUR/USD made one or two attempts to rally on Tuesday, but none of them found much support, and the pair is now back within our 1.1090 (S1) support line and the 1.1200 (R1) resistance line. Even though the price moved somewhat higher and breached temporarily the 1.1200 (R1) resistance line, the failure to overcome that level keeps the short-term picture negative. I believe that a break below 1.1090 (S1) would extend the near-term downtrend and perhaps open the way for the 1.1025 (S2) zone. Looking at our short-term oscillators, the MACD has topped slightly above its zero line and moved lower below its trigger line. The RSI stands just below its 50 line pointing down. These momentum signs support the notion that the next move is most likely a decline.
• As for the broader trend, given that on the 26th of August EUR/USD fell back below 1.1500, I would maintain my neutral stance. The move below that psychological hurdle confirmed that the surge on the 24th of the month was a false break out. Therefore, I would like to see another move above 1.1500 before assuming that the overall outlook is back positive. On the downside, a break below the 1.0800 hurdle is the move that could shift the picture to negative.
• Support: 1.1090 (S1), 1.1025 (S2), 1.0965 (S3)
• Resistance: 1.1200 (R1), 1.1245 (R2), 1.1315 (R3)
GBP/USD above the key level of 1.5330
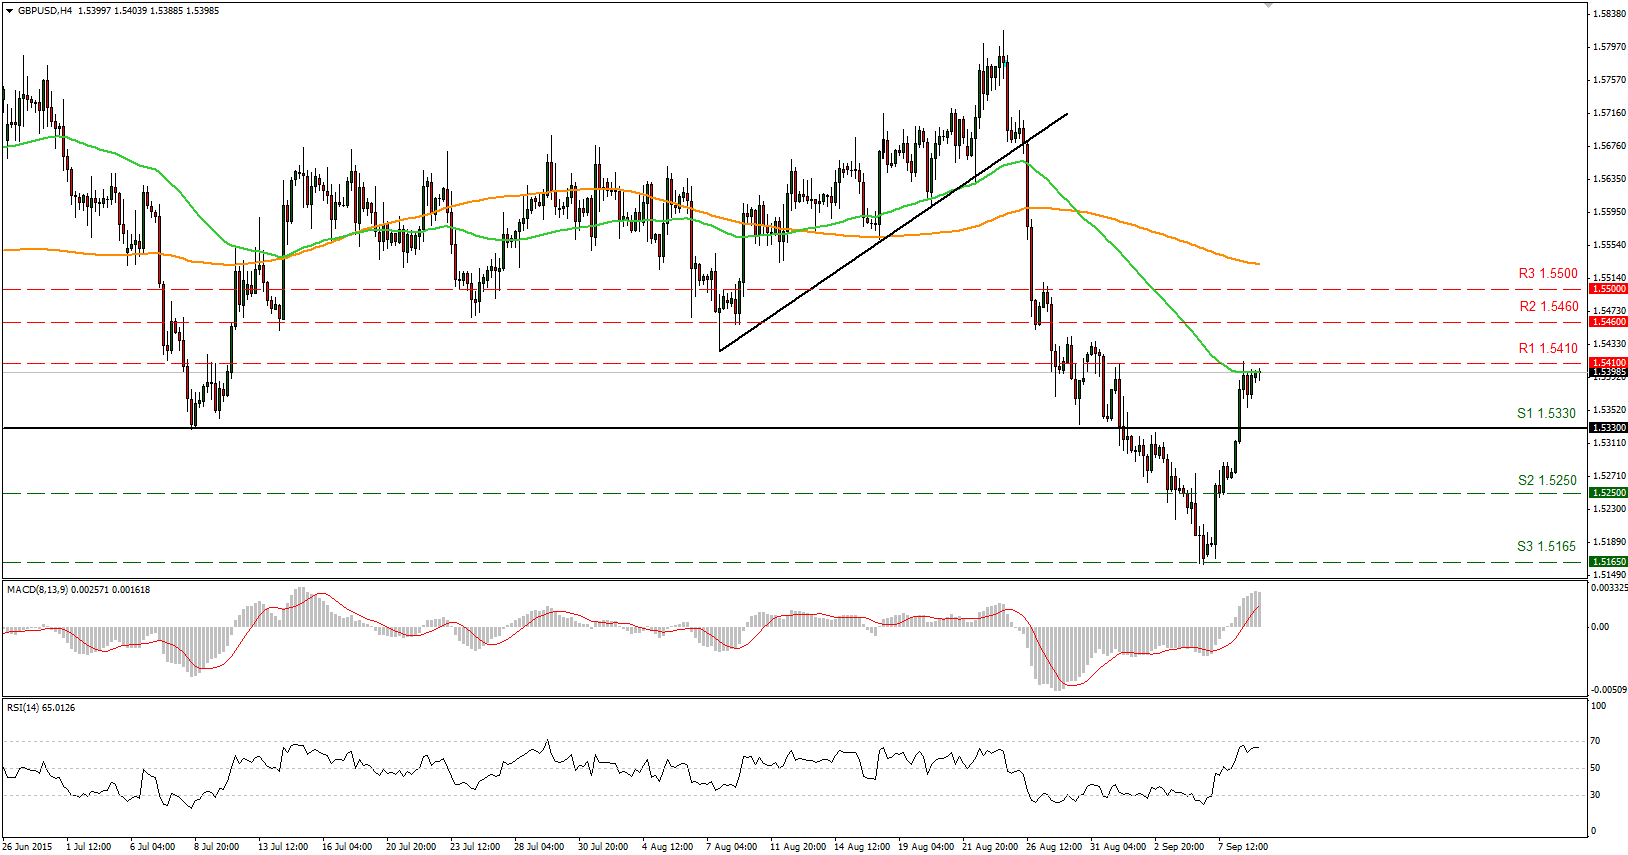
• GBP/USD broke above the key resistance-turned-into-support of 1.5330 (S1) and moved higher to test our next resistance of 1.5410 (R1). A strong and clear break above that level is needed to trigger further extensions, perhaps towards our next resistance of 1.5460 (R2). Our short-term momentum indicators, however, support a minor correction before the next leg higher. The RSI found resistance twice near the 70 line and points down, while the MACD, already above its zero and trigger lines, seems to have topped and could move a bit lower.
• As for the bigger picture, the collapse on the 26th of August brought the rate back below the 80-day exponential moving average, which is a bearish move in my view. However, the move above the key 1.5330 (S1) barrier has shifted the broader trend to neutral for now, as further advances could be on the cards.
• Support: 1.5330 (S1), 1.5250 (S2), 1.5165 (S3)
• Resistance: 1.5410 (R1), 1.5460 (R2), 1.5500 (R3)
USD/JPY above 120.00
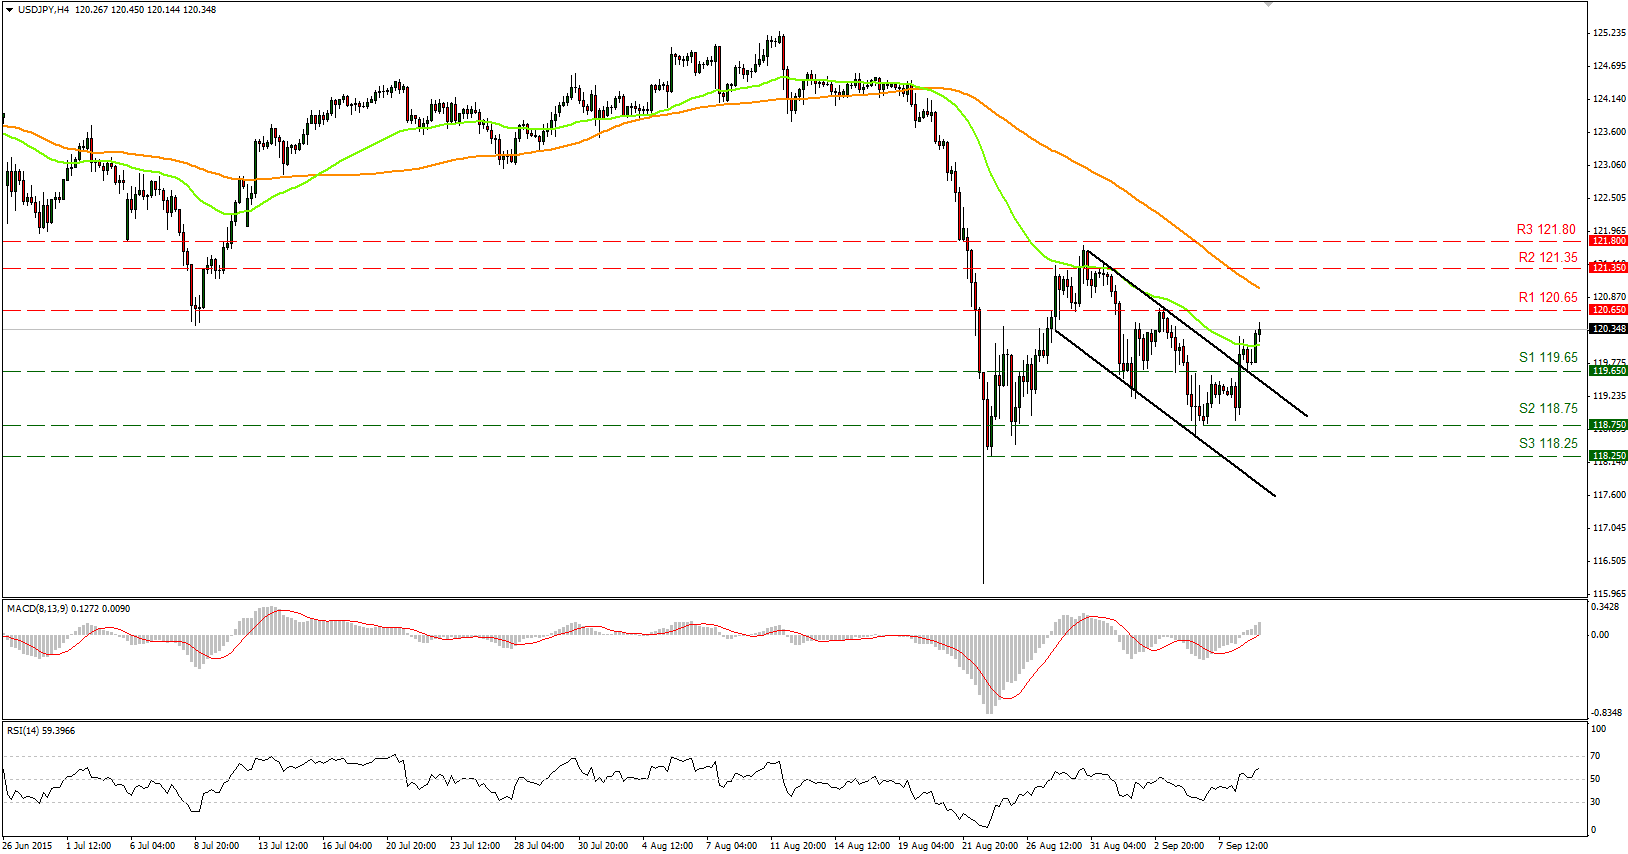
• USD/JPY broke above our resistance-turned-into-support barrier of 119.65 (S1) and above the upper boundary of the of the downslope channel. Since the rate is trading above that channel that has been containing the price action since the 28th of August, I would consider the short-term trend to be slightly positive. A break above the 120.65 (R1) barrier could see scope for extensions towards our next resistance at 121.35 (R2). Our short-term momentum studies support this notion. The RSI found support at its 50 line and bounced up, while the MACD, already above its trigger line, moved higher into positive territory.
• As for the broader trend, the plunge on the 24th of August signaled the completion of a possible double-top formation. Even though this keeps the overall picture somewhat to the downside, a break above the 120.65 (R1) resistance level is likely to shift the bias to neutral.
• Support: 119.65 (S1), 118.75 (S2), 118.25 (S3)
• Resistance: 120.65 (R1), 121.35 (R2), 121.80 (R3)
WTI to test the uptrend line as a resistance
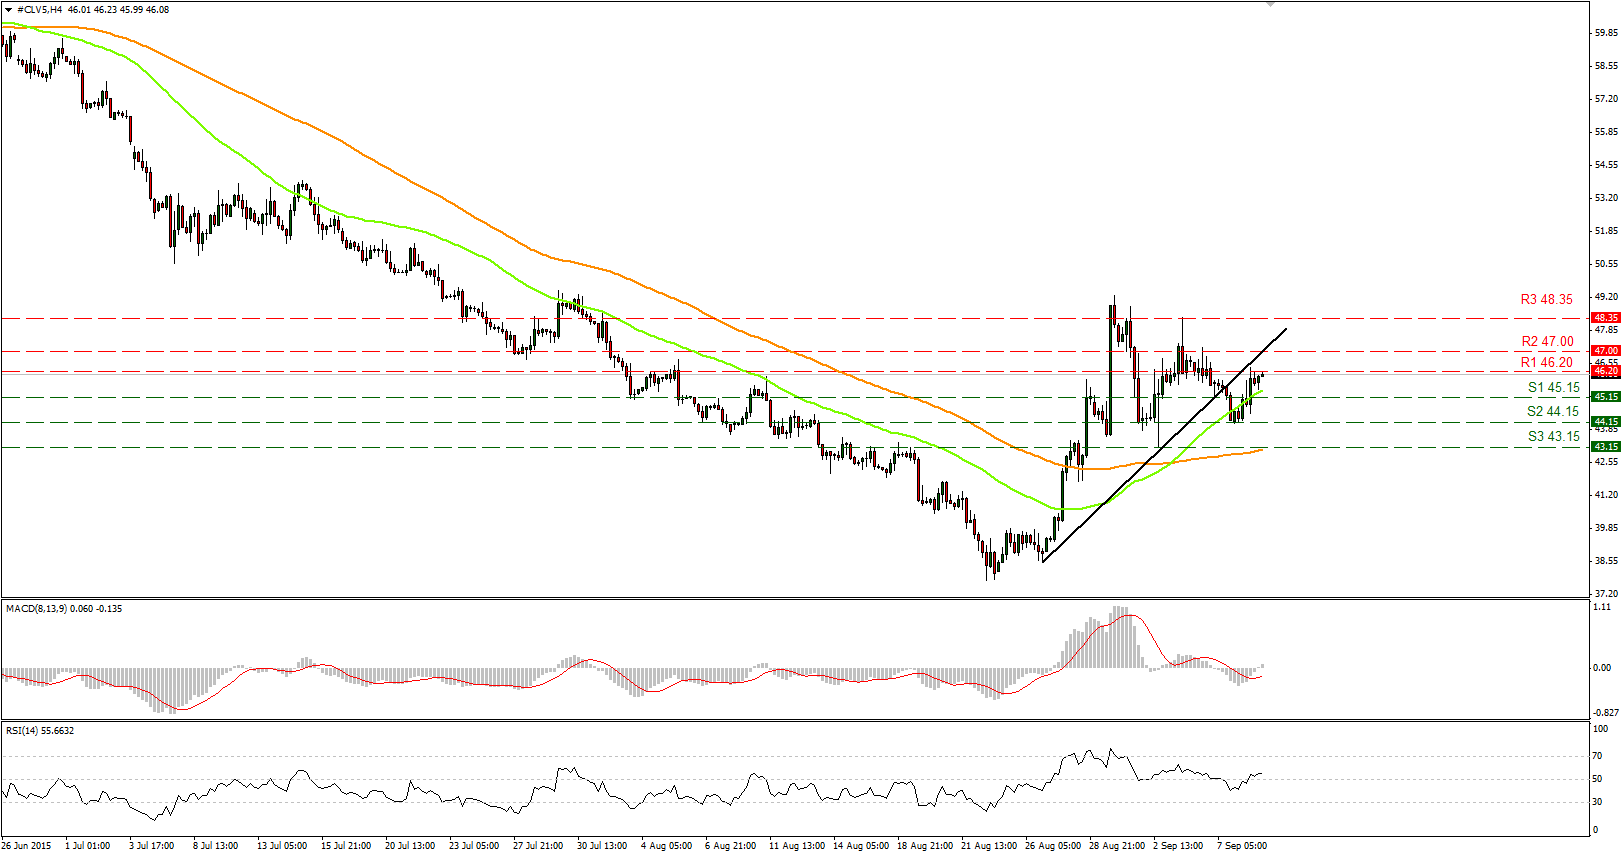
• WTI traded higher on Tuesday after it found some buy orders near the 44.15 (S2) support hurdle. During the early European trading session Wednesday, the price is making an attempt to break above the 46.20 (R1) resistance line. A break above that level is likely to push the rate towards our next resistance of 47.00 (R2), and for a test of the uptrend line taken from the low of the 26th of August as a resistance this time. Since the price broke below that line and could test it as a resistance, I would shift my view to neutral for now. I would prefer to see a clear break above 47.00 (R2) to trust further advances, or a failure to break it to push the price lower again. Our short-term momentum studies support my neutral stance, as both of them lie near their equilibrium levels pointing sideways.
• On the daily chart, I still see a longer-term downtrend. As a result, I would treat any short-term advances as a corrective move of that major downside path.
• Support: 45.15 (S1), 44.15 (S2), 43.15 (S3)
• Resistance: 46.20 (R1) 47.00 (R2), 48.35 (R3)
Gold still in a consolidation mode
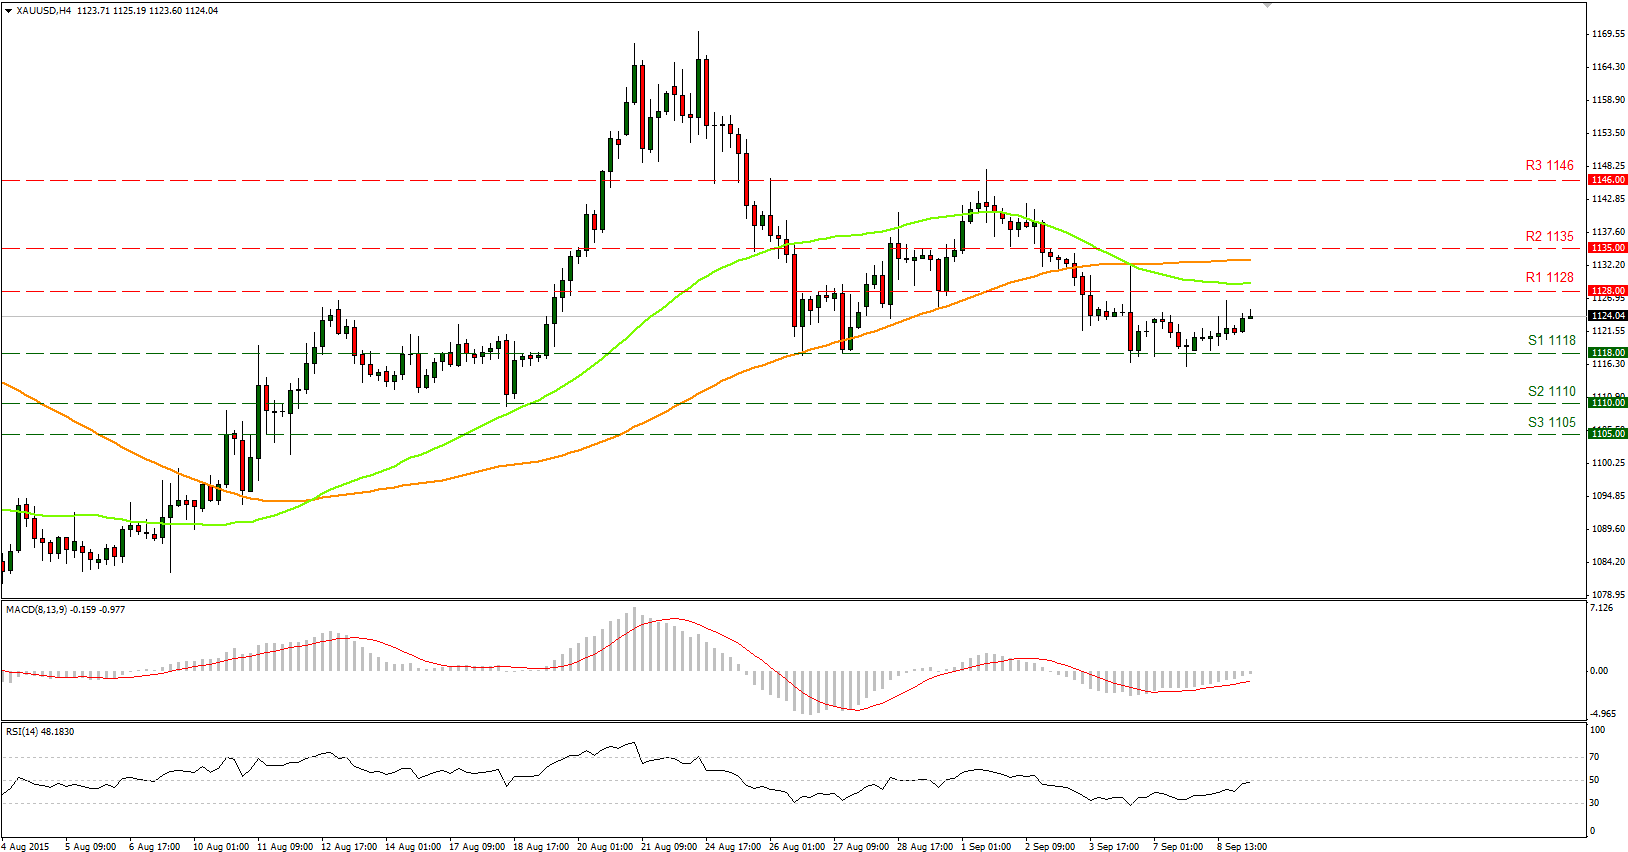
• Gold is still moving within a sideways path, within a tight range between the 1128 (R1) resistance line and the 1118 (S1) support level. I believe that a break in either direction is likely to determine the forthcoming near-term bias. Looking at our short-term oscillators, I believe that the next wave is most likely to be lower. The RSI found resistance slightly below the 50 level, while the MACD, already below its zero line, show signs of topping and seems ready to cross below its trigger line. The momentum evident in these indicators supports my view that the next move could be to the downside. A break below the 1118 (S1) hurdle is likely to target our next support at 1110 (S2).
• As for the broader trend, with no clear trending structure on the daily chart, I would hold my neutral stance as far as the overall outlook is concerned.
• Support: 1118 (S1), 1110 (S2), 1105 (S3)
• Resistance: 1128 (R1), 1135 (R2), 1146 (R3)

