• Below-consensus ADP sets market up for asymmetrical response to NFP Wednesday’s ADP employment report was slightly below estimates at 190k (market median estimate: 200k), but was still within the one standard deviation range of estimates (189k-217k). Also, it must be said that August tends to be a weak month for payroll data anyway, so I’m not sure a miss would be that significant. Last year’s nonfarm payroll figure for August was a shockingly low rise of only 142k, but that was followed by gains of 248k, 214k, 321k and 252k, so clearly the August shortfall didn’t signal any abrupt change in the labor market. (In fact, the August 2014 figure was eventually revised up to 213k, demonstrating that even the NFP figure itself is not a very reliable leading indicator of the NFP figure.) Indeed, the somewhat weak ADP report may have inoculated the market against a weak NFP number tomorrow. That is to say, market participants may be revising down their estimate for NFP (market consensus: 217k) in light of the ADP number, so a surprise on the downside could have less impact than a surprise on the upside.
• In any event, we are starting to hear talk about a rate hike in the US at the October meeting as a possible compromise between those who hesitate to hike while the markets are in such a jittery mood and those who are pretty much committed to starting the process this year. The October meeting does not have a press conference scheduled, but Fed Chair Yellen has said in the past that that wouldn’t be an obstacle.
• Australia data adds to AUD woes The data out overnight for Australia added to the currency’s woes. Retail sales for July unexpectedly fell on a mom basis instead of rising as expected, while the June figure was revised lower. This was the first decline since May 2014 and calls into question whether domestic demand can substitute for shrinking export demand as China slows. Q2 GDP growth was only half as strong as expected and this July figure suggests Q3 is getting off to a slow start too. At the same time, the trade deficit for July was narrower than expected, but the June figure was revised to be wider than initially thought. All in all, it seems only a matter of time to me before AUD/USD falls decisively below the 0.70 level.
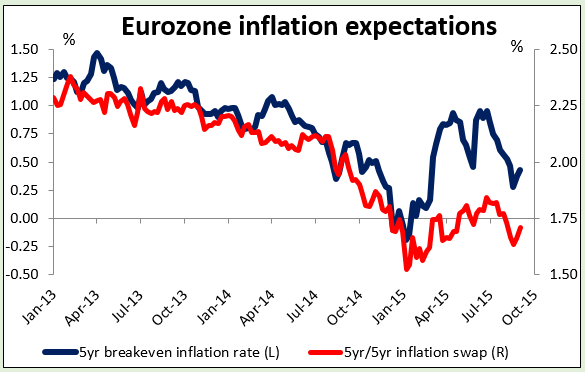
• All eyes on ECB today During the European day, all eyes will be on the ECB. Following the Jackson Hole Symposium, ECB President Draghi will be the first major central banker to address a monetary policy meeting. Both the BoE and the Fed will meet later this month. On the 25th of August, ECB Vice President Vitor Constancio said that it is too early for the ECB to react to China’s situation, as it is not clear how it would impact Eurozone’s economy. We agree with him, and we do not expect the Bank to take any action at this meeting. We do expect the Council to reiterate its easing bias and to stress again that in case of an unwarranted tightening of monetary policy or material change in the inflation outlook, “the Governing Council would respond to such a situation by using all the instruments available within its mandate.” Note that inflation expectations began to rise earlier this year, following the introduction of the ECB’s QE program, but they have been falling back recently, indicating that QE has not been successful in changing the inflation outlook. As a result, we expect the ECB to leave the door open for further action and we will look for hints on what actions they could possibly take, such as increasing the size of the monthly allotment or extending the duration of the QE program.
• Along with the policy decision, we will get a new set of staff projections for growth and inflation until the end of 2017. We believe that Bank officials are likely to lower their growth projections slightly because of the lower than anticipated Q2 GDP figure and the recent strength of EUR. The stronger EUR, alongside the recent fall in oil prices, is likely to also weigh on the near-term projections for inflation.
• Sweden’s Riksbank expected to stand pat too At their last meeting on 2 July, the Bank surprised the market by cutting its key interest rate further into negative territory and expanding its bond purchases program. Since then, the country fell back into deflation in July and the krona has become stronger than the Bank had forecast, especially as its QE program undermined liquidity in the country’s bond market and drove yields higher instead of lower. Although the market expects no change in rates at this meeting, I see the possibility for the Bank to act. That would probably weaken the krona and push USD/SEK back above the psychological zone of 8.5000.
• China on holiday China’s markets are closed for a holiday today and tomorrow. Much of the volatility in global markets has originated in the Chinese stock market, so we may have two days of relative calm – depending of course on the ECB and tomorrow’s NFP figure.
• Today’s indicators: We get the final service-sector PMIs for August from the countries we got the manufacturing data for on Tuesday. As usual, the final forecasts for France, Germany and Eurozone are the same as the initial estimates, therefore the market reaction is usually limited at these releases. Eurozone’s retail sales for July are coming out as well.
• The UK service-sector PMI is forecast to have risen slightly, to 57.7 from 57.4. Given that on Wednesday, the construction index missed estimates and that the manufacturing one unexpectedly declined on Tuesday, another miss in the service-sector PMI looks possible.
• In the US, the both the final Markit service-sector and the ISM non-manufacturing PMIs are expected to have declined. The market pays more attention to the ISM index. A possible decline in ISM non-manufacturing composite will be in line with the decline in the manufacturing index, and could push USD lower, at least temporarily. The nation’s trade balance for July and the initial jobless claims for the week ended on Aug. 29 are also coming out.
The Market
EUR/USD breaks below the uptrend line ahead of the ECB meeting
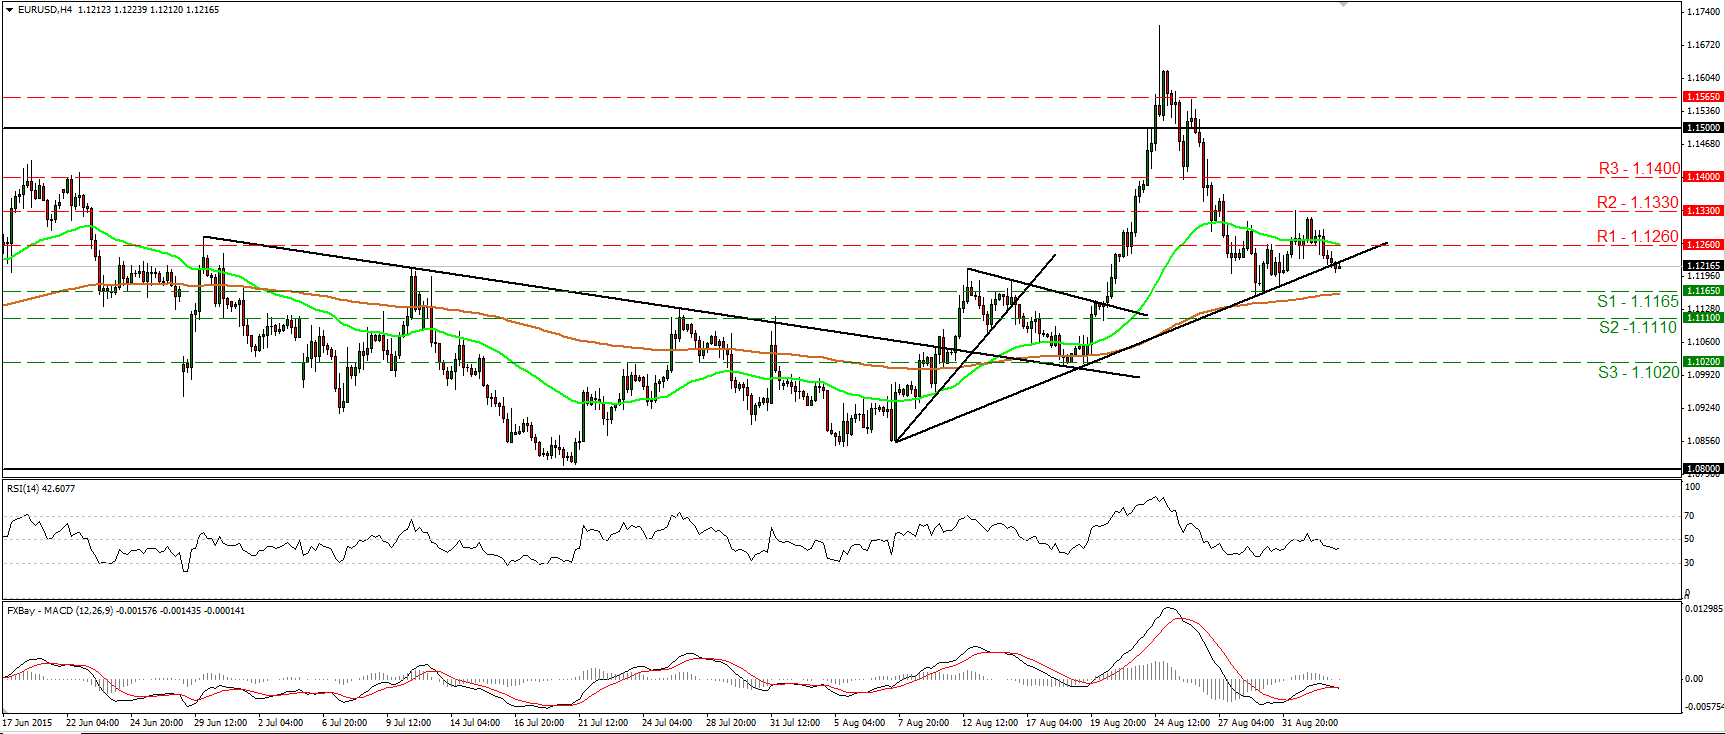
• EUR/USD traded lower on Wednesday, falling below the 1.1260 (R1) hurdle and breaking below the uptrend line taken from the low of the 7th of August. I believe that this could encourage the bears to challenge the 1.1165 (S1) barrier. A dip below that barrier would confirm a forthcoming lower low on the 4-hour chart and perhaps aim for the 1.1110 (S2) line. Today, the ECB holds its monetary policy meeting. Although no change in policy is expected, we do expect the Bank to leave the door open for possible action in the future. This could be the trigger for the next bearish leg in
•EUR/USD. Our momentum studies support the notion as well. The RSI fell back below its 50 line, while the MACD, although negative, has topped and fallen below its trigger line. As for the broader trend, given that on the 26th of August, EUR/USD fell back below 1.1500, I would hold my neutral stance. The move below that psychological hurdle confirmed that the surge on the 24th of the month was a false break out. Therefore, I would like to see another move above 1.1500 before assuming that the overall outlook is back positive. On the downside, a break below the 1.0800 hurdle is the move that could shift the picture negative.
• Support: 1.1165 (S1), 1.1110 (S2), 1.1020 (S3)
• Resistance: 1.1260 (R1), 1.1330 (R2), 1.1400 (R3)
GBP/JPY rebounds from slightly above 182.50
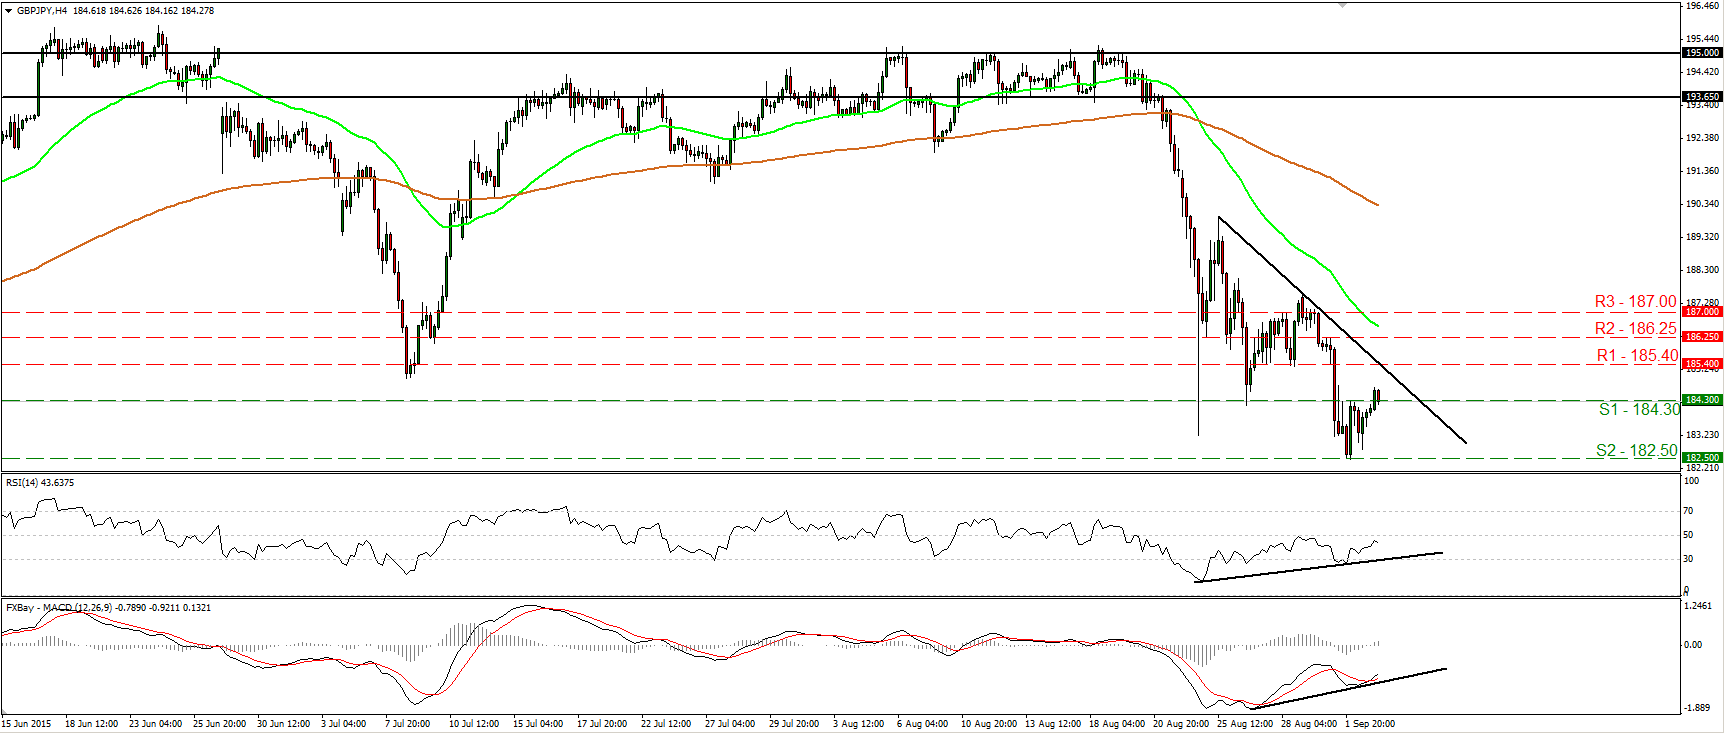
• GBP/JPY traded higher yesterday, after it found support slightly above Tuesday’s low of 182.50 (S2). Subsequently, the rate emerged above the resistance (now turned into support) line of 184.30 (S1). The price structure on the 4-hour chart still suggests a short-term downtrend, but taking a look at our oscillators, I see the possibility that the rebound may continue for a while. The RSI edged higher after finding support slightly below its 30 line, while the MACD has bottomed and crossed above its trigger line. What is more, there is positive divergence between these two indicators and the price action. On the daily chart, the completion of a double top formation has shifted the medium-term bias negative in my view. However, a break below 182.50 (S2) is needed to confirm a forthcoming lower low, something that could open the door for the 181.40 (S3) area.
• Support: 184.30 (S1), 182.50 (S2), 181.40 (S3)
• Resistance: 185.40 (R1), 186.25 (R2), 187.00 (R3)
NZD/USD trades in a consolidative manner
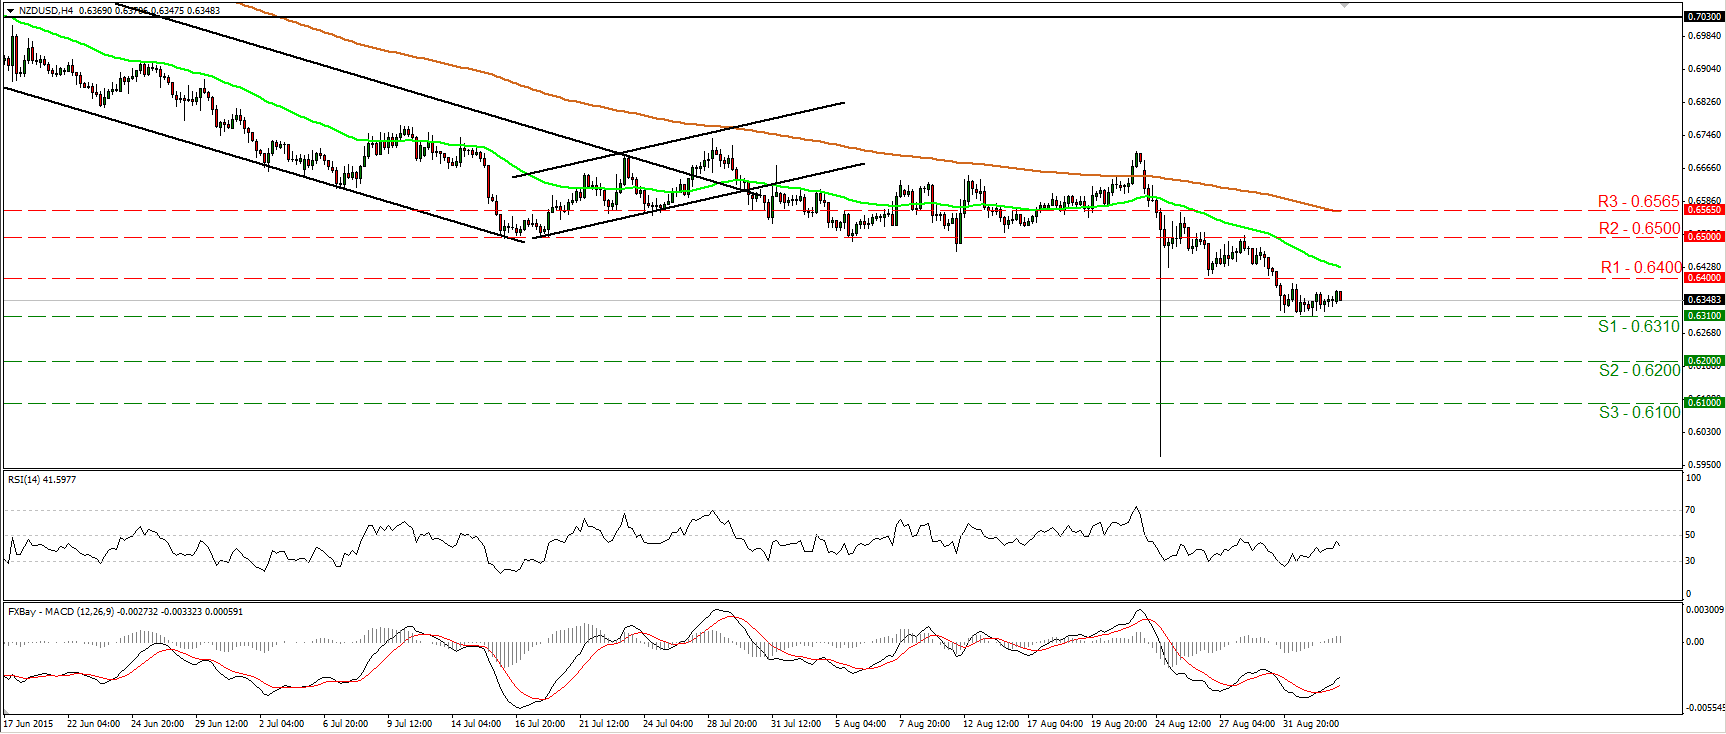
• NZD/USD traded in a consolidative manner on Wednesday, staying between the support of 0.6310 (S1) and the resistance of 0.6400 (S2). On the 4-hour chart, I still see a lower peaks and lower troughs, hence I would expect a decisive dip below 0.6310 (S1) to open the way for the 0.6200 (S2) zone. The RSI turned down after it hit resistance slightly below its 50 line, but the MACD, although negative, stands above its trigger line and points up. These mixed momentum signs give evidence that a minor bounce could be looming, and enhance my view to wait for a break below 0.6310 (S1) before betting more confident on the downside. On the daily chart, the overall path of NZD/USD is still to the downside. As a result, I would treat any possible near-term advances as providing renewed selling opportunities.
• Support: 0.6310 (S1), 0.6200 (S2), 0.6100 (S3)
• Resistance: 0.6400 (R1), 0.6500 (R2), 0.6565 (R3)
DAX futures hit support at 9925 and rebound
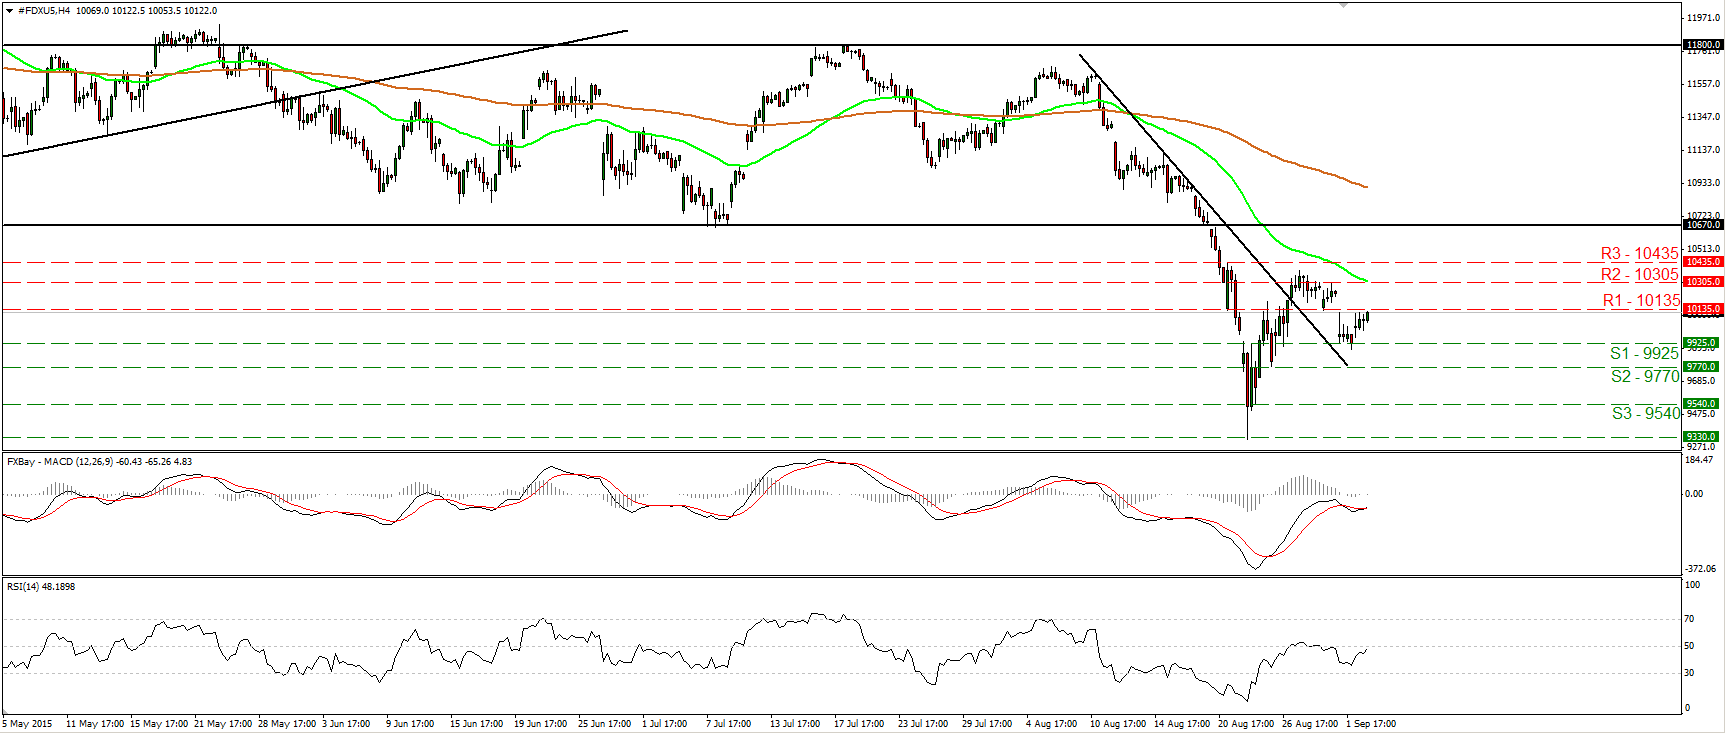
• DAX futures rebounded after finding support slightly below the 9925 (S1) barrier and they currently look ready to challenge the 10135 (R1) barrier. The index is still trading above the short-term downtrend line drawn from the peak of the 10th of August and as a result, I would expect a break above 10135 (R1) to open the way for the next resistance at 10305 (R2). The RSI has turned north and now appears ready to move above its 50 line, while the MACD, although negative, has crossed above its trigger line and could turn positive soon. On the daily chart, the break below 10670 on the 20th of August has shifted the medium-term outlook to the downside, in my view. Therefore, I would treat any future near-term advances that stay limited below the 10670 zone as a corrective phase.
• Support: 9925 (S1), 9770 (S2), 9540 (S3)
• Resistance: 10135 (R1) 10305 (R2), 10435 (R3)
Gold falls below 1135
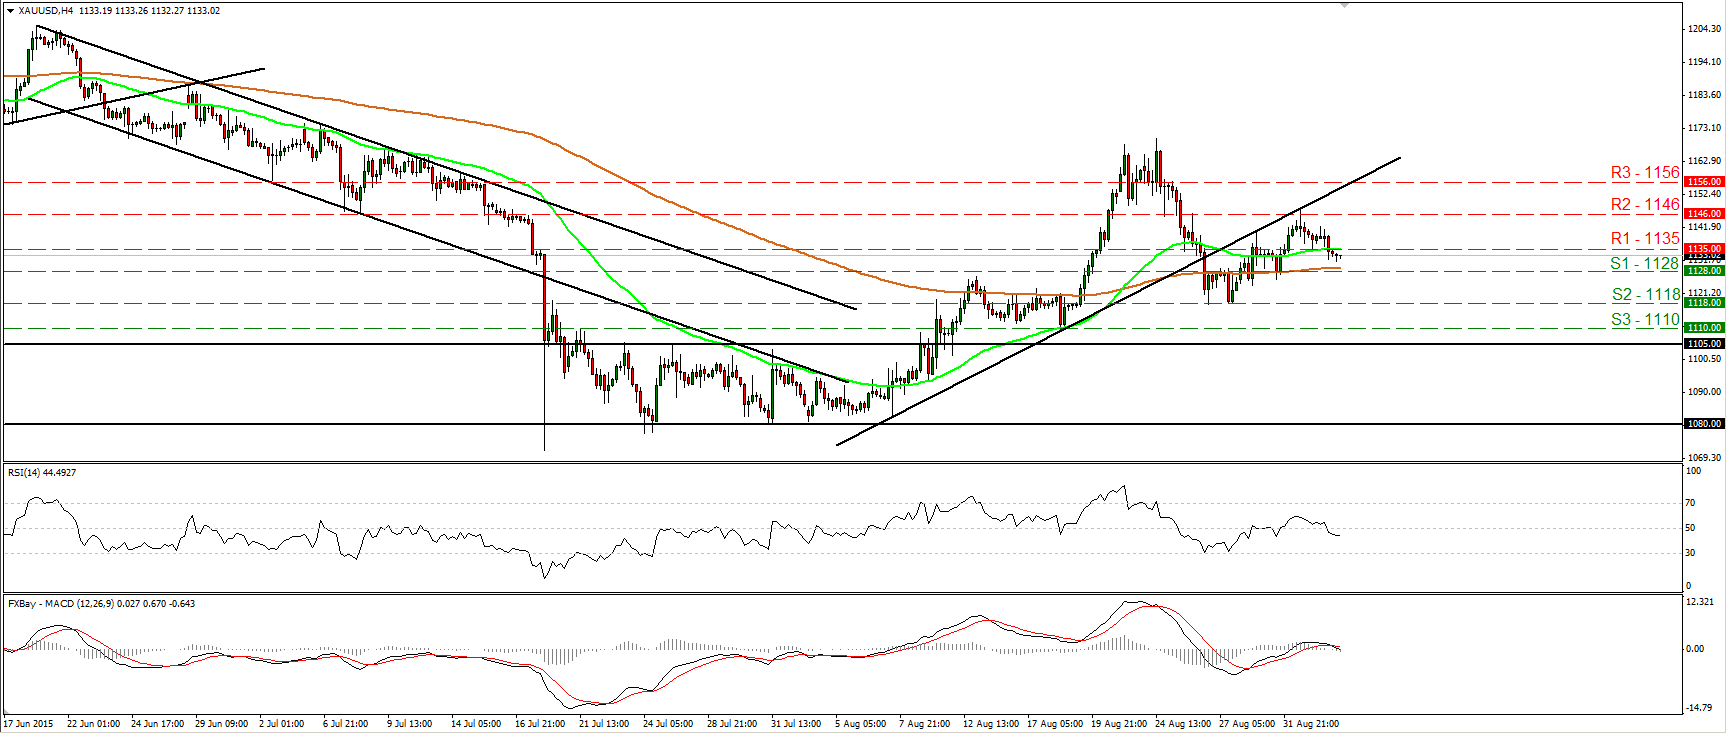
• Gold slid yesterday and fell below the support (turned into resistance) barrier of 1135 (R1). I would now expect the metal to challenge the 1128 (S1) line, where a break is likely to open the way for the next support at 1118 (S2). Our short-term oscillators detect negative momentum and amplify the case that further declines could be on the cards. The RSI fell below its 50 line and is now pointing down, while the MACD has topped and fallen below both its zero and signal lines. As for the bigger picture, with no clear trending structure on the daily chart, I would hold my neutral stance as far as the overall outlook is concerned.
• Support: 1128 (S1), 1118 (S2), 1110 (S3)
• Resistance: 1135 (R1), 1146 (R2), 1156 (R3)

