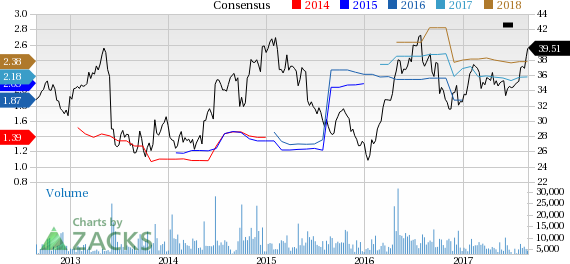
About a month has gone by since the last earnings report for Iron Mountain Incorporated (NYSE:IRM) . Shares have added about 12.4% in that time frame, outperforming the market.
Will the recent positive trend continue leading up to the stock's next earnings release, or is it due for a pullback? Before we dive into how investors and analysts have reacted of late, let's take a quick look at the most recent earnings report in order to get a better handle on the important drivers.
Iron Mountain Q2 FFO Tops Estimates, Revenues Lag
Iron Mountain reported second-quarter 2017 normalized funds from operations (FFO) of $0.55 per share that surpassed the Zacks Consensus Estimate of $0.52 and increased 14.6% year over year.
Adjusted earnings were 30 cents per share, up 22.6% from the year-ago quarter.
However, revenues of $949.8 million missed the Zacks Consensus Estimate of $955.2 million but improved 7.5% year over year. At constant currency (cc), storage revenues were up 10.6% to $590.2 million while service revenues grew 5.1% to $359.6 million. The company achieved internal storage rental growth of 4.8% in the quarter.
Iron Mountain reported adjusted EBITDA of $318.1 million compared with $261.4 million in the year-ago quarter. Moreover, adjusted EBITDA margin improved 390 basis points (bps) to 33.5% from 29.6% in the year-ago quarter.
Per the company, year–over-year improvement in top-line and bottom-line result were mainly driven by synergies from Recall Holdings acquisition, transformation initiatives and continued strong performance of its storage rental business.
Quarter Details
Operating expenses decreased 1% year over year to $779.6 million. Selling, general & administrative (SG&A) expense decreased 14.3% from the year-ago quarter to $237.4 million. Depreciation & Amortization advanced 11.4% year over year to $128.1 million.
Operating income increased 76.1% from the year-ago quarter to $170.2 million. However, operating margin expanded 700 bps to 17.9%.
Iron Mountain exited the quarter with cash and cash equivalents of $291 million compared with $295.6 million as of Mar 31, 2017. Long-term debt was $6.03 billion compared with $5.92 billion as of Mar 31, 2017.
Outlook
The company has reiterated outlook for the full year. Iron Mountain still expects revenues to be in the range of $3.750–$3.840 billion, reflecting 8–10% growth year over year.
Similarly, adjusted EBITDA guidance range of $1.250–$1.280 billion, representing growth of 16–19%, is still maintained. Adjusted FFO is expected to be in the range of $715–$760 million.
Internal storage rental growth rate is expected to be 2.5–3% in 2017. Capital expenditures along with non-real estate investment are projected to be in a bracket of $150–$170 million.
How Have Estimates Been Moving Since Then?
Following the release, investors have witnessed a downward trend in fresh estimates. There has been one downward revision in the last 30 days.
Iron Mountain Incorporated Price and Consensus
VGM Scores
At this time, Iron Mountain's stock has an average Growth Score of C, though it lags a bit on the momentum front with a D. Charting a somewhat similar path, the stock was allocated a grade of D on the value side, putting it in the bottom 40% for this investment strategy.
Overall, the stock has an aggregate VGM Score of D. If you aren't focused on one strategy, this score is the one you should be interested in.
Zacks' style scores indicate that the company's stock is suitable solely for growth investors.
Outlook
Estimates have been broadly trending downward for the stock. The magnitude of this revision also indicates a downward shift. Notably, the stock has a Zacks Rank #3 (Hold). We expect in-line returns from the stock in the next few months.
Iron Mountain Incorporated (IRM): Free Stock Analysis Report
Original post
Zacks Investment Research

