Talking Points
- Iraq conflict stirs Crude Oil volatility
- US crude inventories in focus
- Gold elevated by geopolitical tensions
Crude oil is set for another volatile session with US inventories and Durable Goods Orders data on tap, with additional guidance offered by ongoing concerns over supply disruptions from Iraq. Meanwhile geopolitical tensions could continue to keep Silver and Gold prices elevated in spite of a slight recovery for the greenback in recent trading.
Inventories, Iraq Offer Crude Traders Guidance
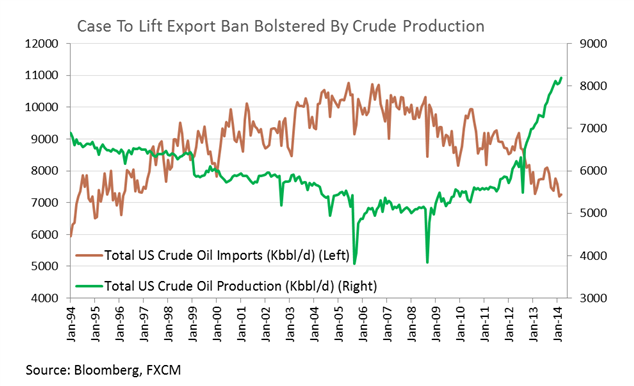
Upcoming inventories data is tipped to reveal a decline in total crude stockpiles of 1.7 million barrels for the week according to the median estimate from economists (full details on the economic calendar here). While this would mark the fourth consecutive drawdown for the reading, total inventories remain near record levels which were reached in April. Additionally, with US crude production at its highest since 1986 a supply glut is evident in the US oil market. This leaves further gains for the growth-sensitive commodity to hinge on speculation over a strong US economic recovery. An upside surprise to US Durable Goods Orders data set to cross the wires in the session ahead would likely play into that theme and could keep WTI elevated.
Concerns over crude supply disruptions from Iraq have also offered a source of support to the WTI and Brent benchmarks in recent trading. Reports from newswires suggest the country’s largest oil refinery, Baiji, has been seized by militants in the latest of a series of escalating conflicts in the region. However, at this stage production has not been impinged by the attacks. Further, OPEC officials have noted that its other members would be able to increase production to offset any declines from Iraqi supply in order to achieve the group’s output targets. With overall supply unlikely to be affected, this may leave crude oil vulnerable to a pullback as traders unwind fear-driven positioning in the commodity.
Also noteworthy in the crude oil space are reports from news sources suggesting that US energy producers may be granted permission to export a ‘light’ grade of the commodity. Details are relatively scant at this stage, however the prospect of the US once again exporting oil after a ban was put in place in 1975, would bring fresh supply to the international market, and likely lead to a narrowing of the WTI and Brent spread.
Gold Supported By Geopolitical Tensions
Heightened geopolitical tensions in the Middle East have likely counteracted cues from a stronger greenback to leave gold treading water near $1,310. With the turmoil in Iraq showing little signs of a swift resolution at this point, investor concerns over a further escalation could continue to keep the precious metal elevated. Additionally, the prospect of a prolonged US Dollar slump as noted in recent commodities reports, could afford gold and silver a recovery.
Crude Oil: Pullback Offered New Long Entry Opportunities
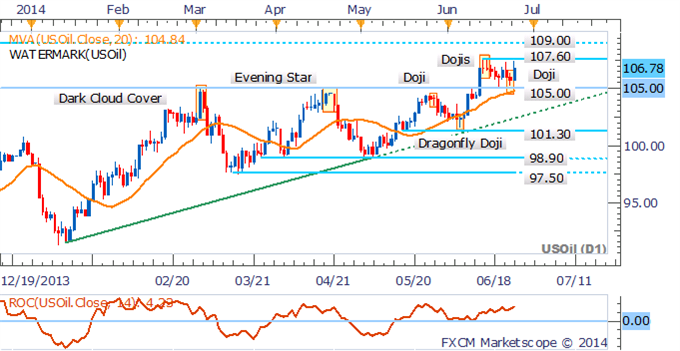
Crude oil’s retreat to support at 105.00 offered a new opportunity for longs, given the uptrend for the commodity remains intact. With resistance looming nearby at 107.60, current levels may not afford an ideal entry. An upside break of 107.60 would open the psychologically-significant 109.00 handle.
Gold: Breakout Affords Bullish Bias
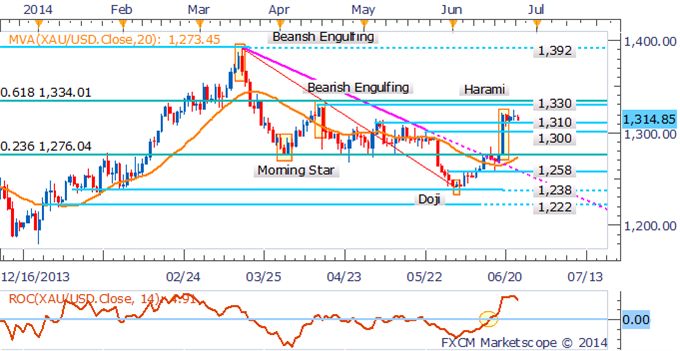
Gold may be primed for a push higher given signs of an uptrend have emerged on the daily chart. A break above several resistance levels and spike in volatility also suggests the potential for further gains. The slight pullback to support at 1,310 is seen as an opportunity for new long entries, with a target offered by the April high near 1,330.
Silver: Correction To Offer New Long Entries
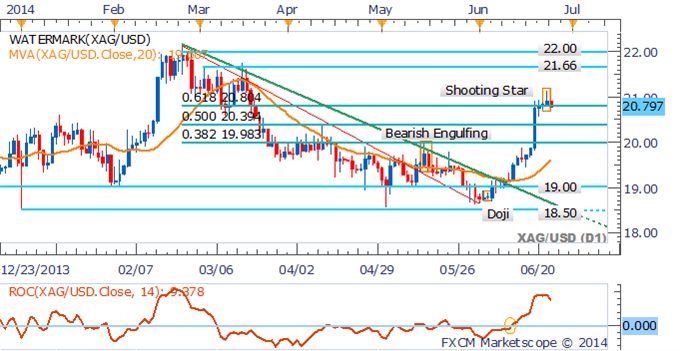
Silver’s ascent has stalled at the 61.8% Fib Retracement Level with a Shooting Star pattern suggesting the potential for a pullback. However, the candlestick likely requires confirmation from a successive down day to be validated. A correction would be seen as an opportunity to enter new long positions given the uptrend remains intact (signaled by the Rate of Change indicator and 20 SMA).
Copper: Consecutive Bars Pushes Extremes
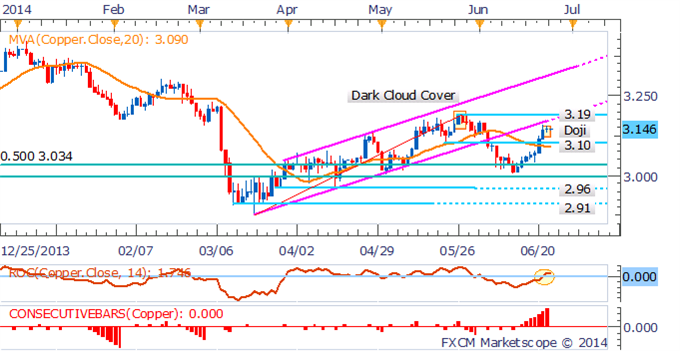
The trend appears to have shifted to the upside for copper following a push above a key resistance level at 3.10. However, skepticism over further gains may be warranted given the base metal has not seen this many consecutive up-days since December 2013, which were shortly followed by a slight retreat. Sellers will likely look to keep the base metal contained below the 3.19 mark.
Palladium: Reversal Pattern Suggests Further Falls Ahead
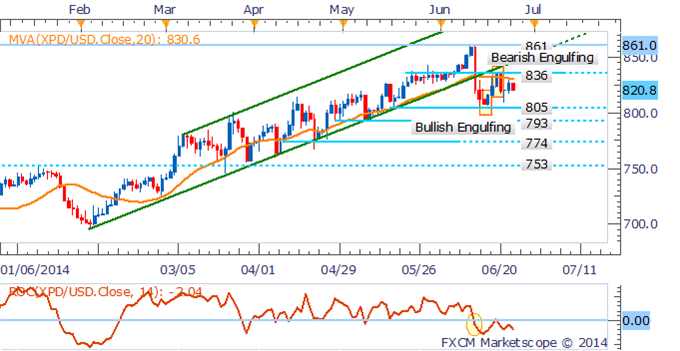
Palladium may be primed to push lower after the precious metal failed to breach resistance at 836, resulting in a Bearish Engulfing candlestick pattern. Further falls are likely to find support at 805.
Platinum: Bears Return Following Dark Cloud Cover Pattern
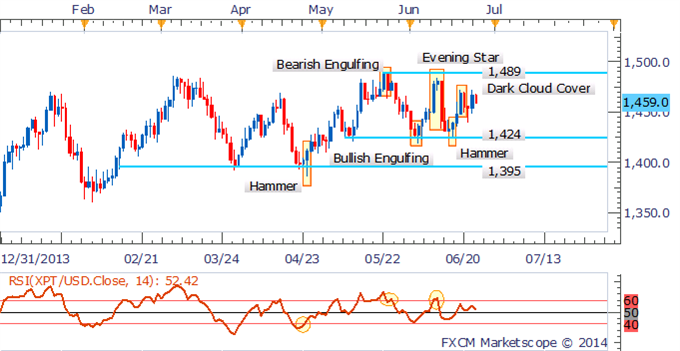
Platinum’s consolidation continues following the bounce off its range-bottom at 1,424. While a Hammer candlestick hinted at a push towards 1,489, the emergence of a Dark Cloud Cover pattern suggests the bears may look to lead a retreat back to 1,424.
