On June 26, 2019, the price of IOTA/USD (MIOTA) reached a low of 32,200 satoshis. Similar lows were reached on June 29. After a gradual increase, the IOTA price again dropped to these levels on July 4.
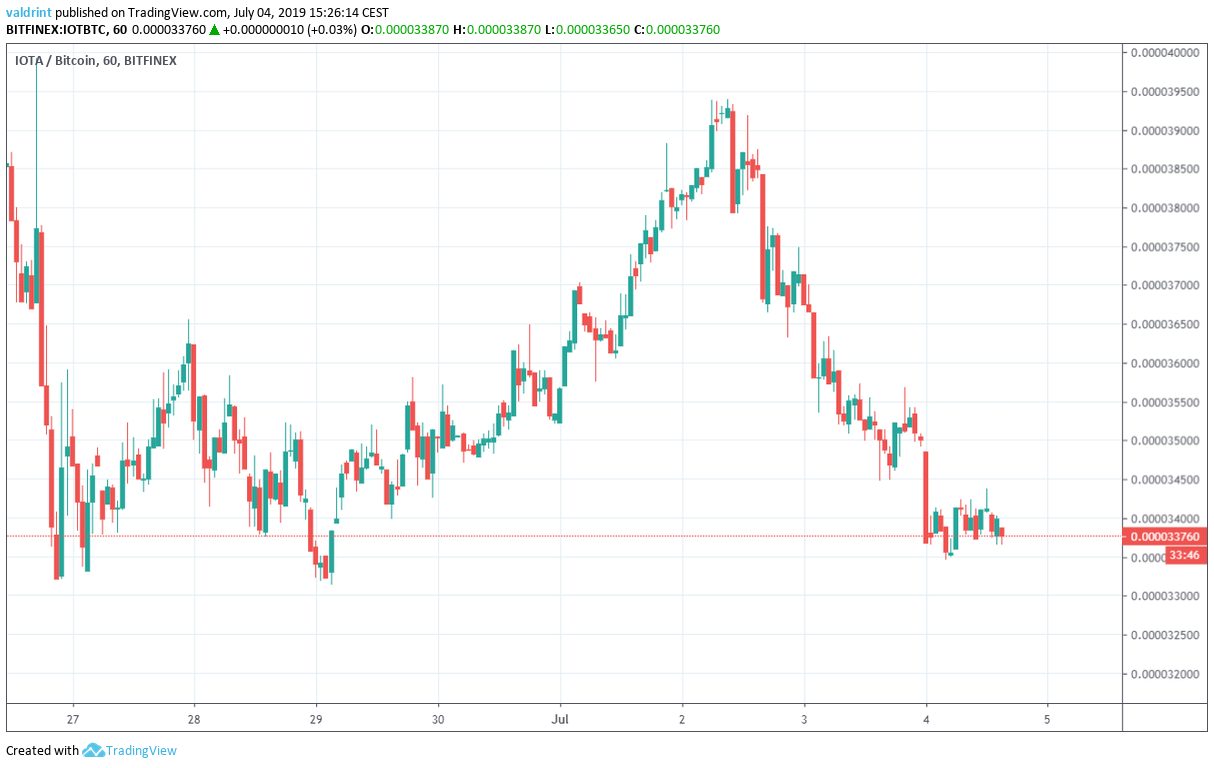
Will the IOTA price begin another upward move or will it break down? Below, we will look at the price in different time-frames alongside technical indicators in order to answer this question.
IOTA Price: Trends And Highlights for July 4
- The IOTA price is trading inside a descending wedge.
- There is significant long-term bullish divergence developing in the RSI and the MACD.
- IOTA/BTC has made a short-term triple bottom.
- There is resistance near 41,000 and 45,000 satoshis.
IOTA Price in a Descending Wedge
Since reaching a low of 72,050 satoshis on Aug 18, 2018, the IOTA price has been trading inside a descending wedge — which isconsidered q bullish pattern.
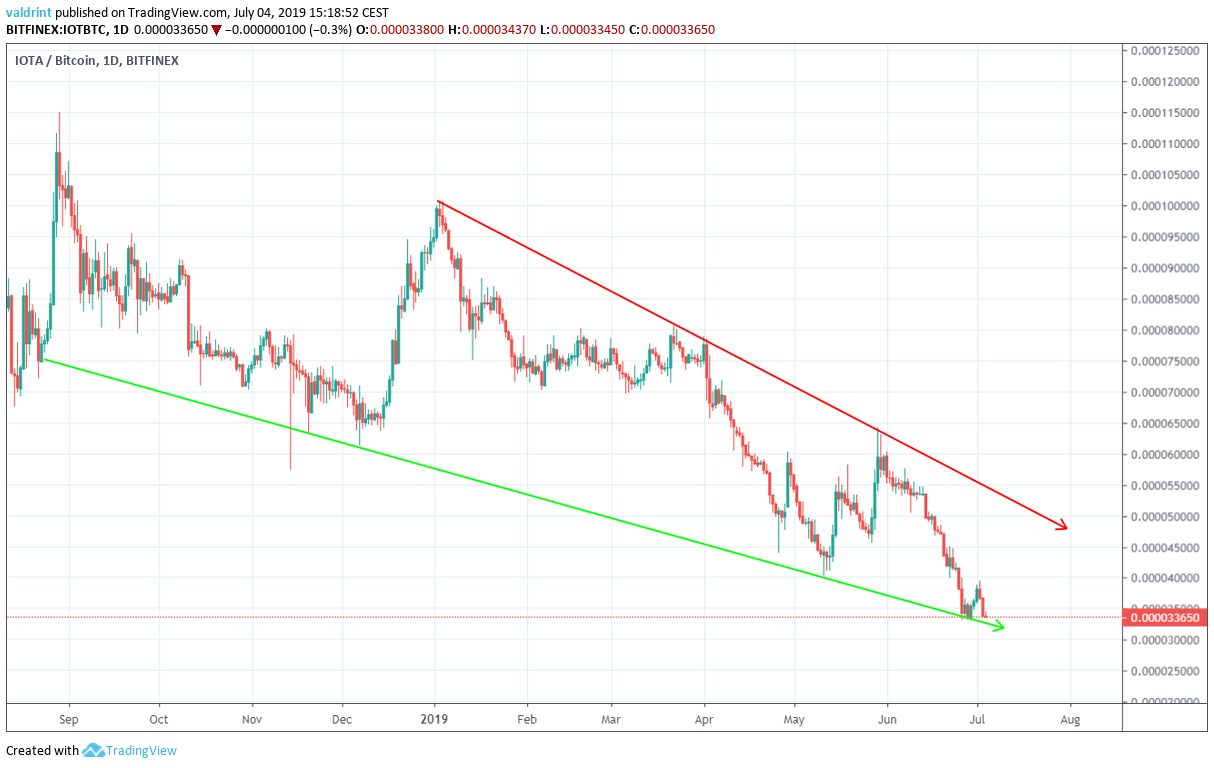
Both the resistance and support lines have been touched several times.
The point of convergence between resistance and support is still a significant distance away.
Therefore, it is possible that the price will continue to trade inside the wedge without experiencing significant fluctuations.
However, a look at the RSI and the MACD suggests that the IOTA price will soon initiate an upward move.
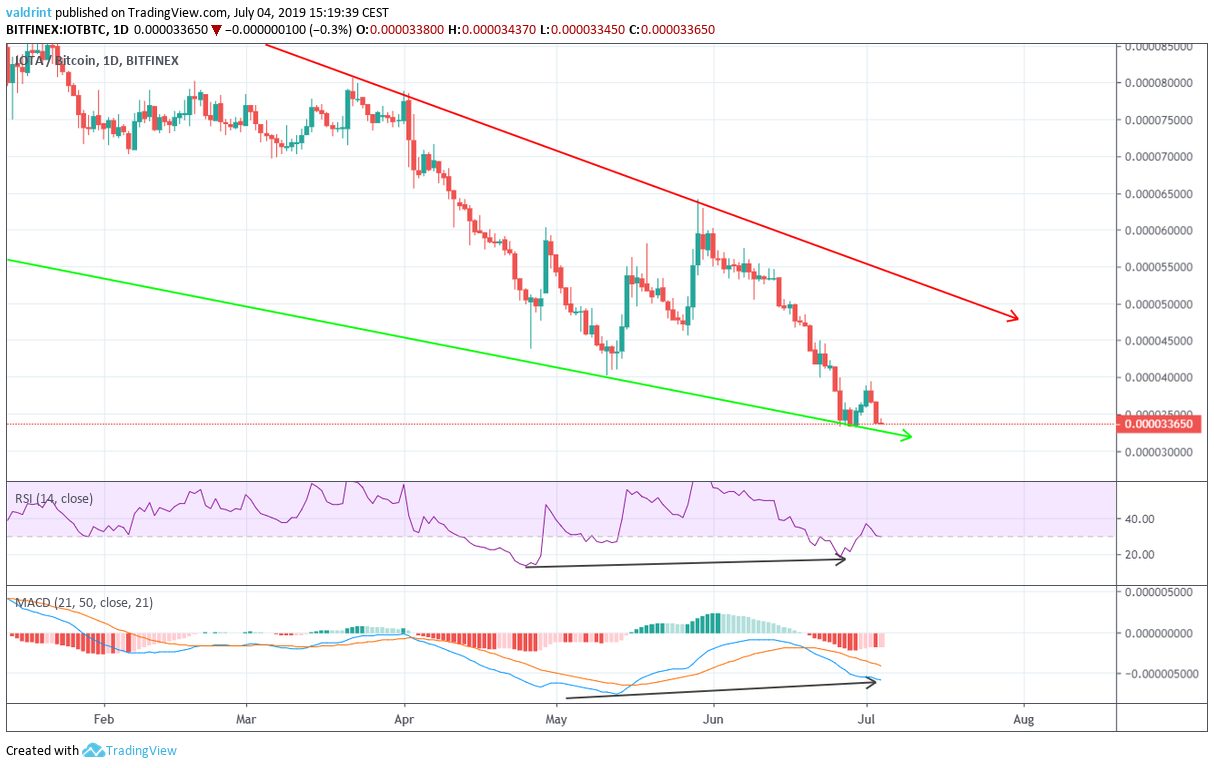
Both indicators have been generating bullish divergence since the beginning of May.
The level of divergence is significant and is occurring on the support line of a bullish pattern.
Therefore, it is likely that the price will soon initiate an upward move towards the resistance line and possibly break out.
Short-Term Support
In the short term, the price has been following a horizontal/slightly increasing support line.
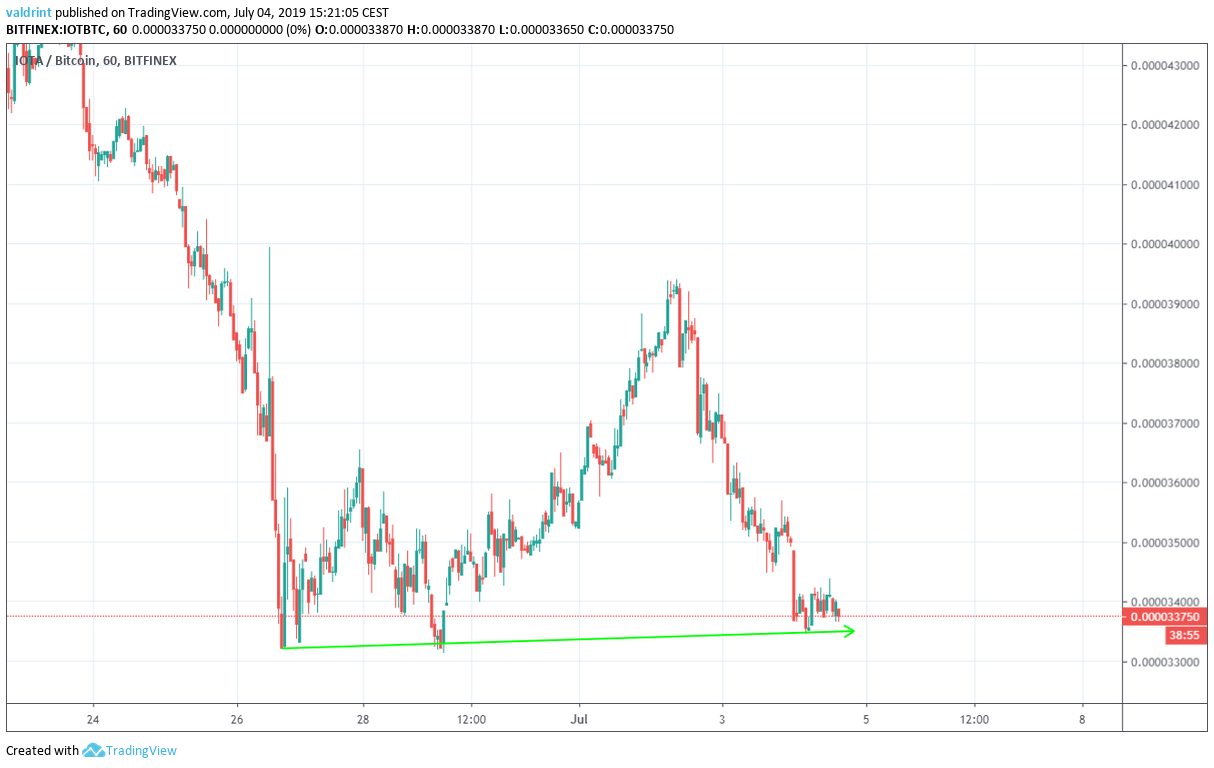
The lows on June 26, 29 and July 4 create a triple bottom pattern, which when found in a downtrend is considered a bullish reversal pattern.
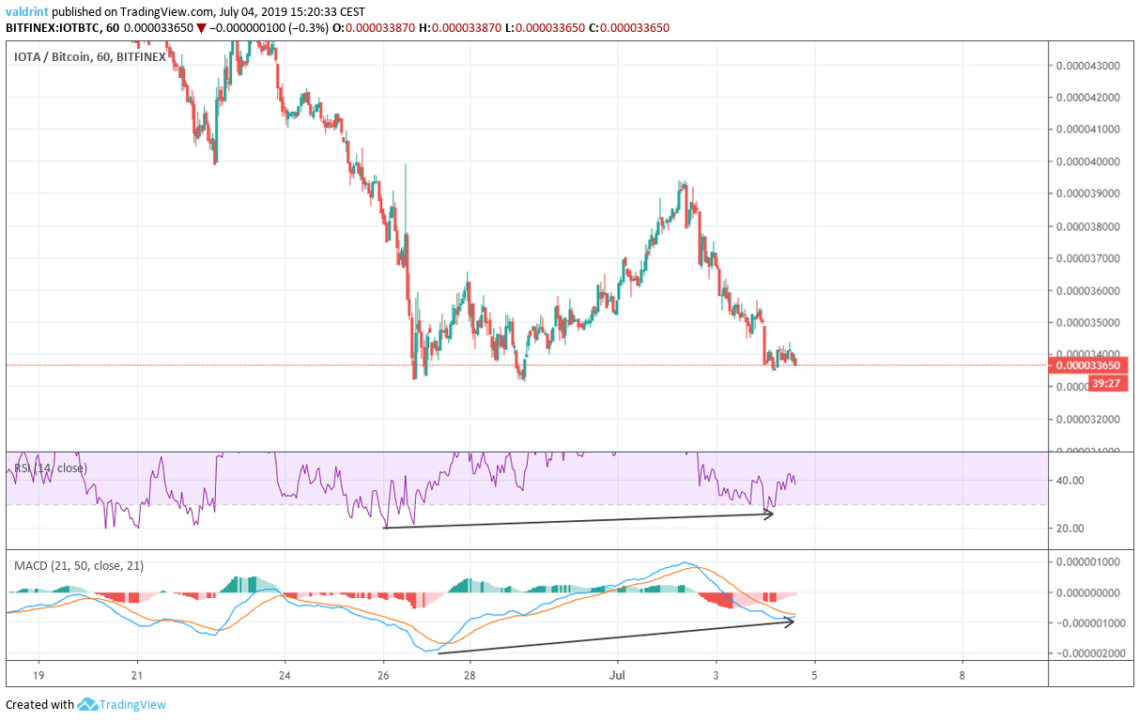
Furthermore, these lows have been combined with bullish divergence.
To conclude, both short- and long- term indicators suggest that an upward move will soon begin.
Resistance Areas
If the price of IOTA begins an upward move, two resistance areas are outlined below.
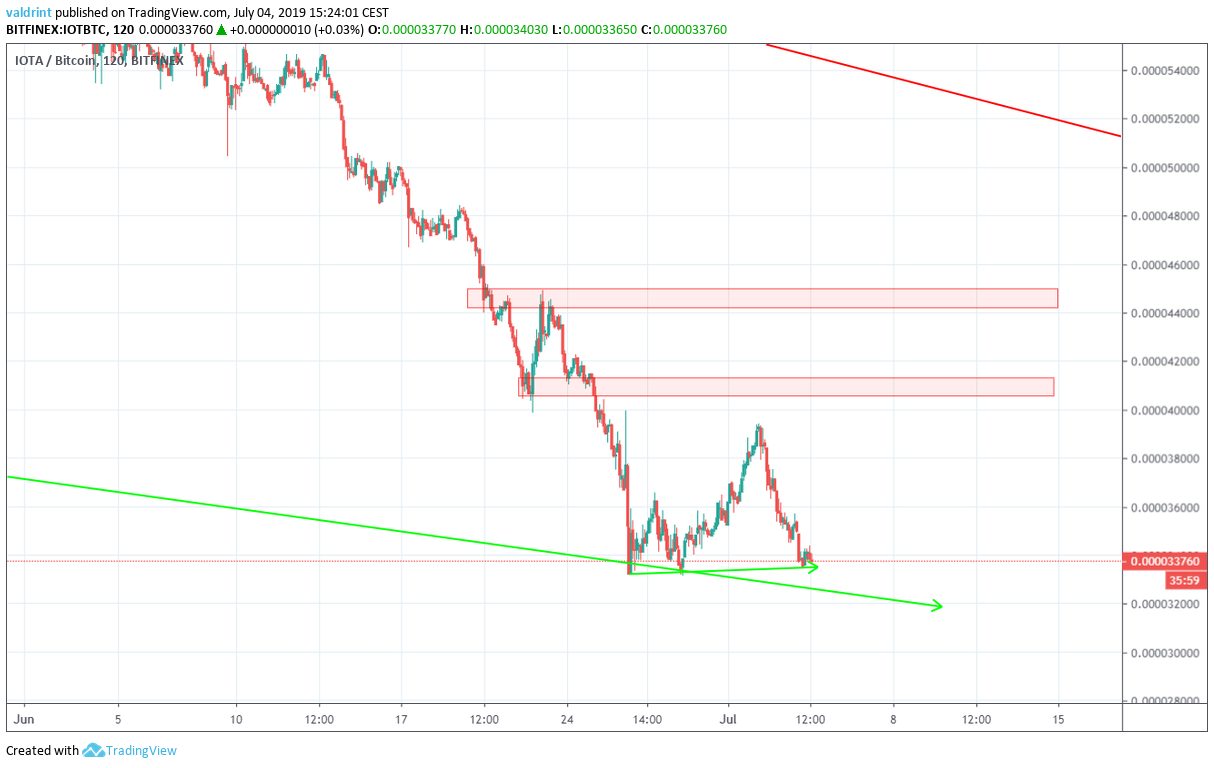
They are found at 42,000 and 45,000 satoshis.
We believe the IOTA price will reach at least one of these areas.
Summary
The price of IOTA has been decreasing significantly since the beginning of 2019.
However, it is currently trading inside a bullish pattern. Furthermore, the momentum indicators suggest that an upward move will begin soon.
If it does, we will expect the IOTA price to reach at least one of the resistance areas outlined above.
