
EU equities slid, US stocks gained, while Asian ones were mixed, with investors perhaps sitting on the edge of their seats in anticipation of the Georgia runoff election outcome. With 96% of the votes being count, Democrats and Republicans appear locked in tight races, with the final results expected to be announced later today.
Markets Trade Mixed As Georgia Runoff Results Loom
The US Dollar traded lower against all the other G10 currencies on Tuesday and during the Asian session Wednesday. It fell the most against AUD, NZD, and CAD in that order, while it underperformed the least versus CHF, GBP, and JPY.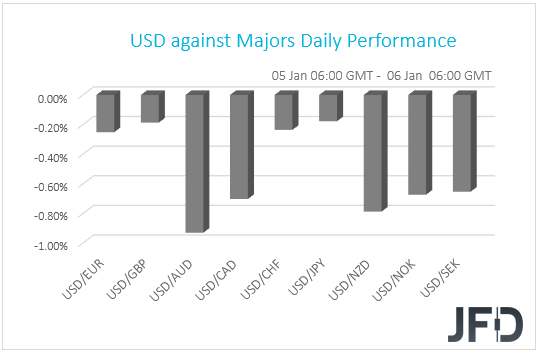
The relative weakness of the safe-havens dollar, yen and franc, combined with the strengthening of the commodity-linked Aussie, Kiwi, and Loonie, suggests that markets traded in a risk-on fashion. That said, taking a look at the equity world, we see that most of the major EU indices closed in negative waters. The exception was UK’s FTSE 100, which gained 0.61%, boosted by oil majors Royal Dutch Shell (LON:RDSa) and BP (NYSE:BP), as oil prices rebounded following Saudi Arabia’s decision to agree and make additional, voluntary cuts of 1mn bpd in February and March. This was part of a deal to persuade other producers in the OPEC+ group to keep output steady.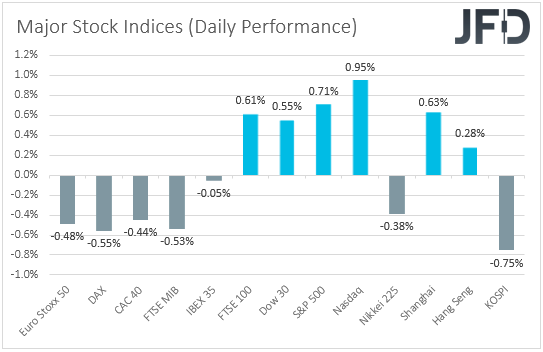
Sentiment improved during the US session, with Wall Street’s main indices gaining 0.74% each, but it eased again during the Asian session today, perhaps as investors sat on their hands in anticipation of the Georgia election outcome. Democrats and Republicans appear locked in tight races, with the final results expected to be announced later today.
As we noted yesterday, a Democratic sweep could raise speculation that President-elect Biden’s fiscal agenda will pass much more easily, which could mean higher stimulus spending. Therefore, the dollar is likely to continue to slide, while equities are likely to continue marching north.
A Democratic controlled Congress could also mean higher taxes and more regulation, which is negative for stocks, but we still believe that due to the coronavirus vaccinations, the fiscal support in the US, the monetary policy easing around the globe, and the Brexit trade accord, the path of least resistance for equities and other risk-linked assets may be to the upside. At the same time, we expect safe havens, like the US dollar and the Japanese yen to stay under selling interest, especially against risk-linked currencies, like the Aussie and the Kiwi.
NZD/USD Technical Outlook
NZD/USD traded higher yesterday, after it hit support at 0.7190. It broke above the 0.7240 barrier, marked by the high of Dec. 31, thereby confirming a forthcoming higher high, and continued to march north during the Asian trading today. Overall, the rate is trading above a medium-term tentative upside support line drawn from the low of Mar. 19, but also above a short-term upside line, taken from the low of Dec. 21. All this paints a positive picture in our view.
We believe that the move above 0.7240 may have opened the way towards the 0.7300 territory, the break of which may set the stage for the high of Apr. 18, 2018, at 0.7345. If that barrier is not able to halt the advance, then we may experience extensions towards the 0.7395 territory, defined as a resistance by the peak of Apr. 13, 2018.
In order to start discussing the case of a short-term reversal, we would like to see a clear and decisive dip below 0.7140, a support marked by the inside swing high of Dec. 28. This would confirm a forthcoming lower low on the 4-hour chart and may initially target the low of the same day, at around 0.7082. Another break, below 0.7082, could see scope for extensions towards the low of Dec. 23, at 0.7030, or the low of Dec. 9, at 0.7010.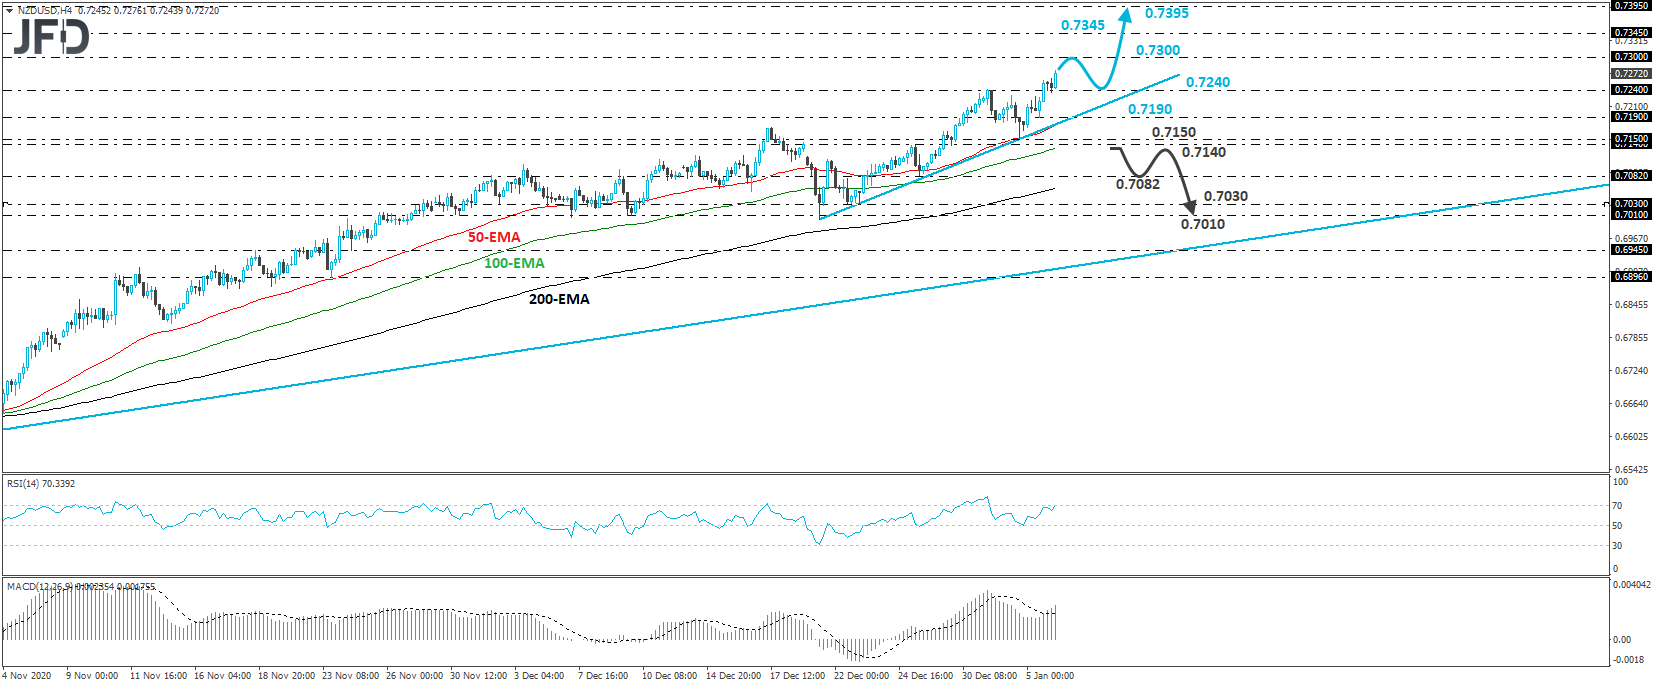
Brent Oil Technical Outlook
Brent oil rebounded strongly yesterday, breaking above Monday’s high of 53.30, thereby confirming a forthcoming higher high on both the 4-hour and daily charts. Overall, the prevailing short-term trend has been to the upside since Nov. 2 and thus, we would consider the near-term outlook to be positive.
We believe that the price may now be headed towards the 54.40 resistance, marked by the high of Mar. 3. The bulls may decide to take a break after testing that zone, thereby allowing the black liquid to correct lower, perhaps towards the 51.90 zone, from where the bulls may retake control and push the price higher, even above 54.40. Something like that may set the stage for extensions towards the 57.00 zone, which is defined as a resistance by the high of Feb. 25.
Alternatively, we would start examining whether the bears have stolen the bulls’ swords, only if we see a deeper decline, below 50.55. Such a move would confirm a forthcoming lower low on the 4-hour chart and may initially target the lows of Dec. 21 and 23, at 49.20. Another break, below 49.20, may allow declines towards 48.15, the break of which could extend the slide towards the low of Dec. 2, at 46.85.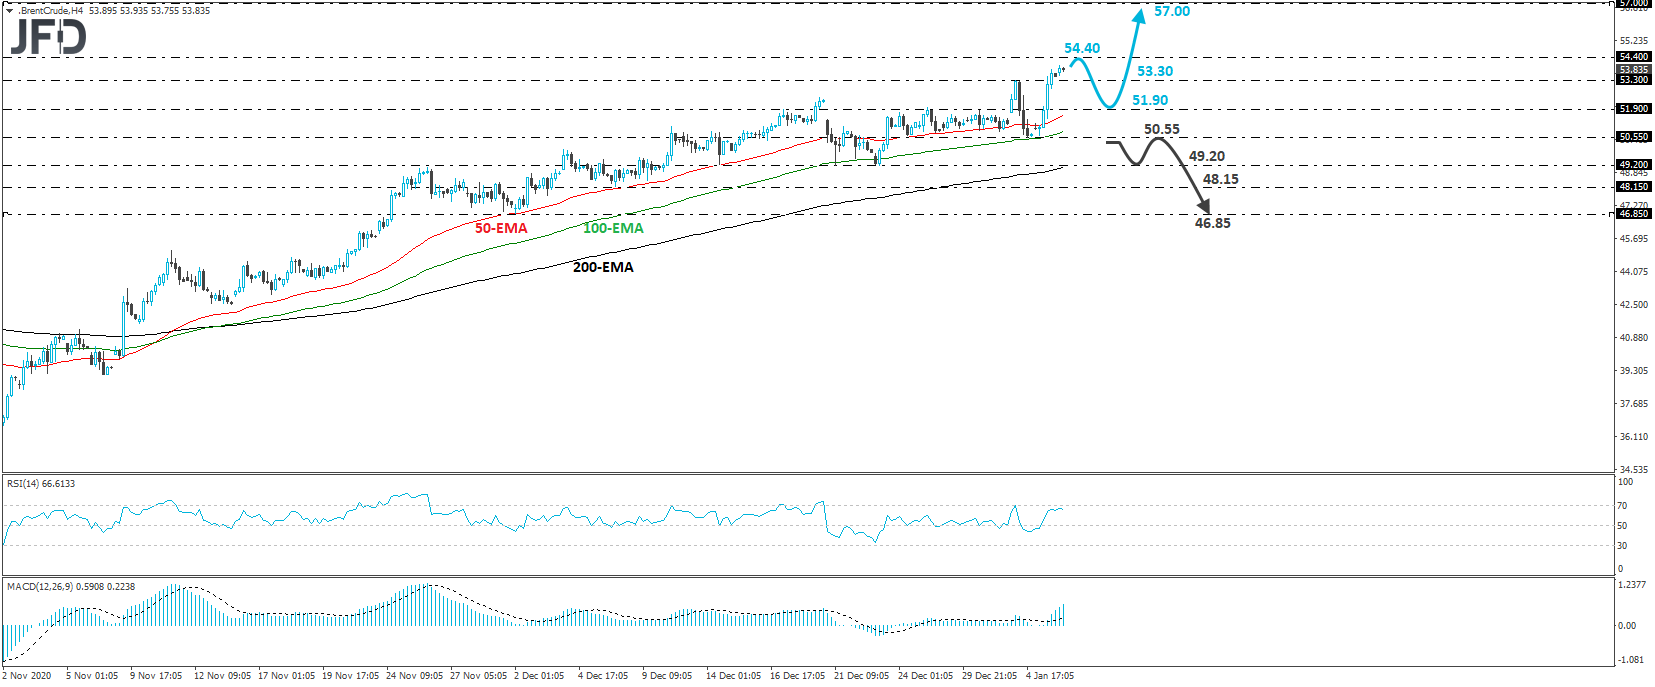
As For Today's Events
Today, the main release may be the minutes from the latest FOMC gathering, at which officials kept policy unchanged, but changed their forward guidance saying that they will continue to buy bonds “until substantial further progress has been made towards the Committee’s maximum employment and price stability goals.” At the press conference following the decision, Fed Chair Powell said that the recovery has been quicker than expected, but he added that they remain open to increasing bond purchases or moving to longer maturities, and if they feel that this will help the economy, they will do it. With that in mind, we will scan the minutes for clues as to how willing Fed officials are to loosen their policy further, and if so, when further action may take place.
As for the data, the final services PMIs for December from the Eurozone, the UK, and the US are due to be released. As always, they are expected to confirm their preliminary estimates. We also get Germany’s preliminary inflation numbers for December. The CPI rate is expected to have remained unchanged at -0.3% yoy, while the HICP one is forecast to have ticked up to -0.6% yoy from -0.7%.
With regards to the energy market, we get the EIA (Energy Information Administration) report on crude oil inventories for last week, which is expected to reveal a 1.271mn barrels slide, following a 6.065mn tumble the week before. With the API (American Petroleum Institute) reporting a 1.663mn barrels slide yesterday, we would consider the risks surrounding the EIA forecast as tilted somewhat to the downside.
Tonight, during the Asian session Thursday, Australia’s trade balance and building approvals for November are coming out. The nation’s trade surplus is expected to have declined to AUD 5.800bn from AUD 7.456bn, while the building approvals are forecast to have declined 3.0% mom, after rising 3.8%.
We also have one speaker on today’s agenda and this is BoE Governor Andrew Bailey.