This article was written exclusively for Investing.com
The narrative suggesting that QE and money printing lead to massive inflation is a fairy tale. The same story was told nearly a decade ago and it simply never developed, leaving many investors very disappointed.
The Fed has gone out of its way to tell investors that the lack of inflation is the biggest threat it faces. What seems hard to understand then is why inflation-linked assets like Gold and Bitcoin are surging.
The Fairy Tale
The fairy tale started a decade ago when the Fed launched QE for the first time. The narrative that quickly began was that inflation would soon follow, and while some asset prices rose for a little bit, it did not last long. Nearly a decade later, even before the pandemic, the Fed was still searching for higher prices.
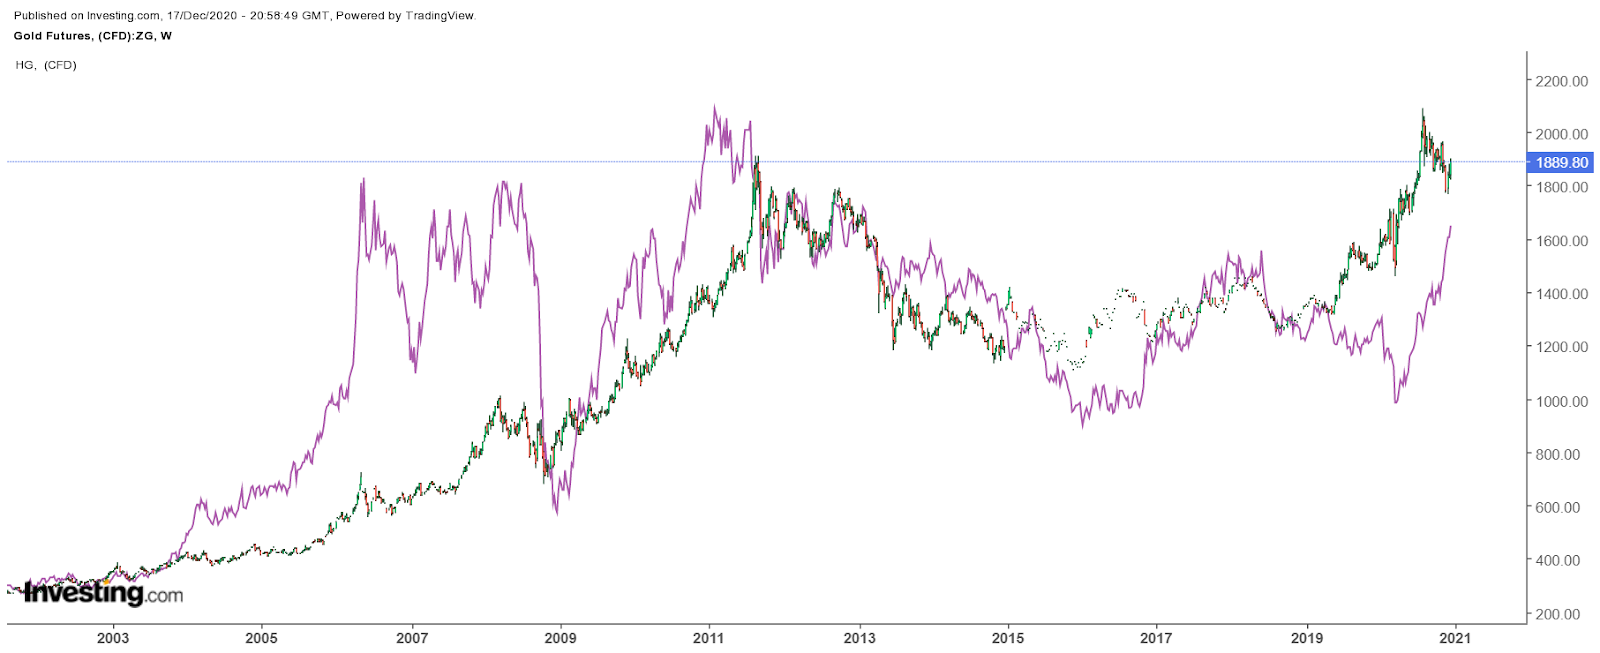
It means that today's investors are likely facing the same disappointment as they did over a decade ago. Gold prices began rising sharply in late 2008 from around $750, peaking in August 2011 at around $1,900. The metal proceeded to decline in value for the next 7 years, falling to as low as $1,000. It wasn't much different for copper, which surged from around $1.30 to almost $4.70. That metal also lost value over the same period.

Amazingly, we are again seeing prices of gold and copper soar along with other commodities. Now we have bitcoin, which has joined the fairy tale, as money printing from the Fed is sure to lead to the dollar's debasement and stoke inflation rates. But, one can easily see in the following charts that it is simply not true.
Where's The Inflation?
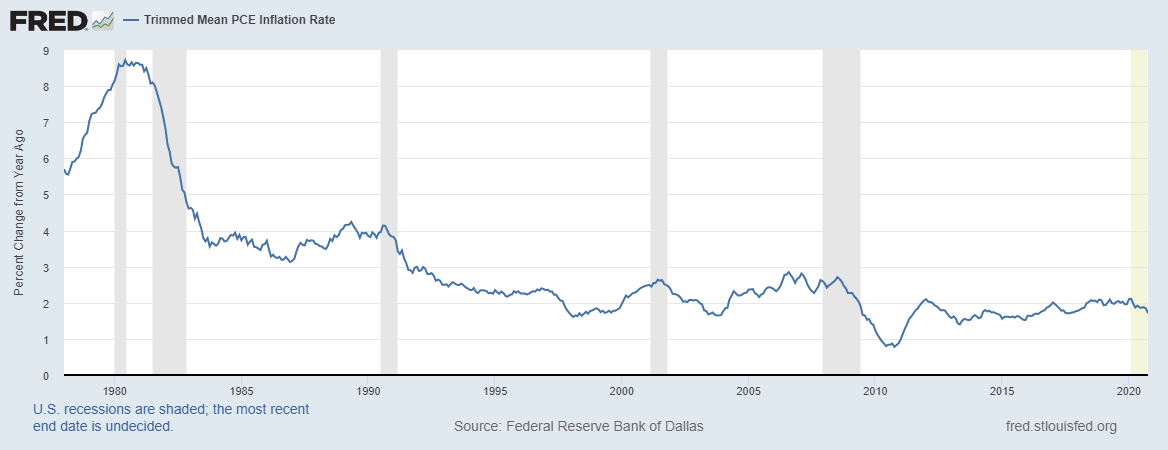
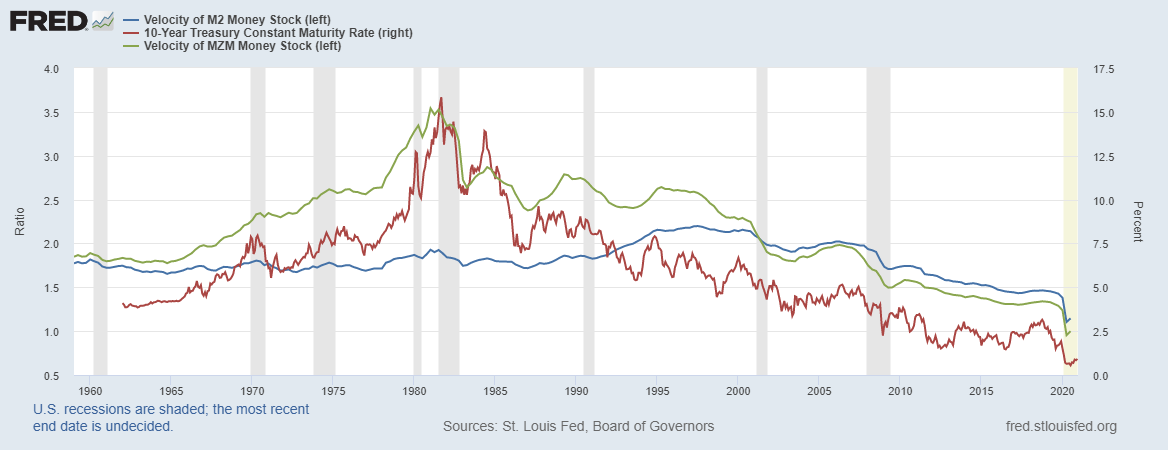
QE itself never promoted inflation following the great financial crisis. The trimmed mean PCE reading of inflation only passed 2% on a handful of occasions since 2009. We also know based on M2 and MZM velocity, too much money printing pushes inflation rates lower. A simple chart of M2 and MZM velocity, compared to 10-year rates, quickly demonstrates that.

The velocity of the money stock is a simple ratio of GDP divided by M2 or MZM. The faster those money quantities rise versus GDP, the slower the money spreads around because there isn't enough stuff being created to increase the demand, pushing prices higher. For example, in the early 1980s, $1 created in MZM created nearly $3.80 in GDP. Today, $1 created in MZM makes just $1 in GDP, disinflation at work. The biggest problem the economy may face is that GDP growth is simply too slow for the money being printed.

Disappointment
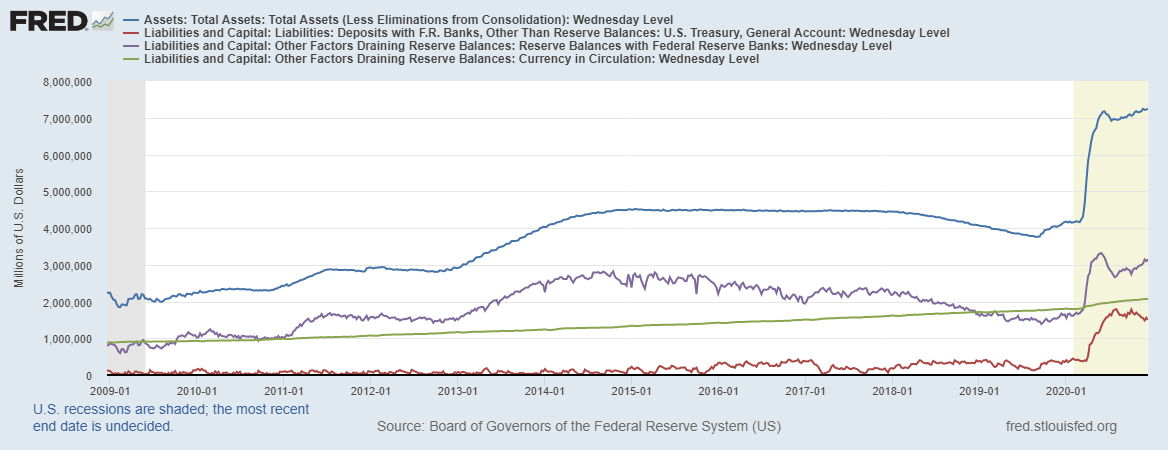
All of the money being created by the Fed today sits in three places: the balance sheets of the banks, the US Treasury, and currency in circulation. Those three accounts hold $6.7 trillion of the Feds $7.2 trillion balance sheet. Therefore, it is impossible to create the inflation that so many are betting will happen, so long as the money remains in those accounts at the Fed.

The concept that all of the money printing today will result in a run-up in prices and produce massive inflation is nearly precisely identical to what happened in 2009 and 2010. The dynamics are likely to end the same way today as it did back then, with disappointed investors that latched on to the same fairy tale.
