The equity market has gone over a year without a pullback of at least 5% or more. The last 5% decline occurred in mid-June 2016 when, over a two week period, the market fell 5.5%. Even in the run up to the election last year, the equity market did not close down over 5%. This lack of volatility is showing up in popular volatility measures like the VIX, but the VIX may not be a good measure of expected future volatility. Also, this lower lower level of volatility has some strategists suggesting investor's have become to complacent about the equity market and have willingly taken on more equity exposure as a result.
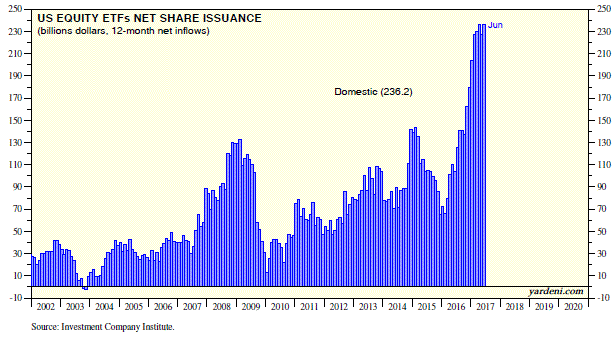
A recent post by Dr. Ed Yardeni, Ph.D., and he puts out some great research, noted individual investors may have become too optimistic as well. In that post, Investors Hearing Call of the Wild, he included the below chart of U.S. equity ETF flows.

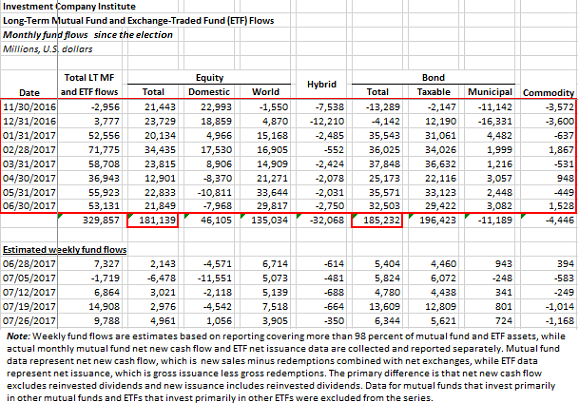
Fortunately, he does note in the post that 'some' of these ETF flows may have come from investors allocating dollars out of mutual funds. In fact ICI reports the total flow into U.S equities over the 12-month period ending in June is only $7.6 billion and not simply the $236.2 billion that flowed into ETFs. Nearly all of the equity flow came out of actively managed mutual funds. I do sense that investors going the passive route may be in for a surprise in the next market correction.
And finally, it should be noted that since the election last year, investors have placed more investment dollars into bond funds then stock funds. Additionally, over the course of the last five weeks ending July 26, 2017, investors have pulled $21.7 billion out of U.S. stock funds while world funds collected $28.3 billion. But still, bond funds have been the net favorite as flows total $36 billion over this same five week period.

In conclusion, as the file in the just noted link above shows, nearly three times as many dollars have flowed into bond funds versus stocks funds since the beginning of 2015. Maybe the potential bubble is in bonds and not stocks.
