Housing stocks have outperformed in 2019, with the SPDR S&P Homebuilders (NYSE:XHB) up 32% year-to-date. More recently, XHB shares bounced sharply from their rising 120-day moving average in mid-August, and rallied to a 19-month high of $44.04 on Sept. 13. The fund has since eased back from here, but is up fractionally today at $43.07 after a higher-than-expected rise in new home sales in August, and before a busy stretch of homebuilder earnings.
Raymond James is bullish on the housing sector ahead of earnings. The brokerage firm upgraded KB Home (NYSE:KBH), Lennar Corporation (NYSE:LEN), and Toll Brothers Inc (NYSE:TOL) to "outperform" from "market perform," saying it expects earnings will "reveal decidedly improved housing fundamentals," while August housing data signaled "a far more bullish backdrop for homebuilders into year-end."
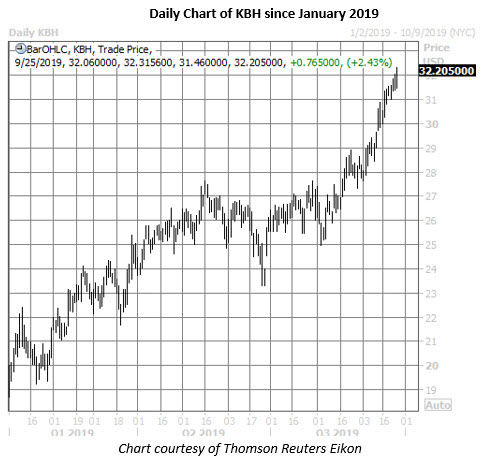
For KB Home, this upgrade comes directly ahead of its turn in the earnings confessional, slated for after tonight's close. KBH stock is up 2.4% at $32.20, at last check, fresh off an annual high of $32.31, and bringing its year-to-date gain past 68%.
KB Home stock is coming of back-to-back earnings wins, having closed higher the next day in March and June. It looks like options traders are positioning for another post-earnings pop. The October 32 and 33 calls are most popular in KBH's active options pits today, and data from the International Securities Exchange (ISE) shows some buy-to-open activity occurring at each strike.

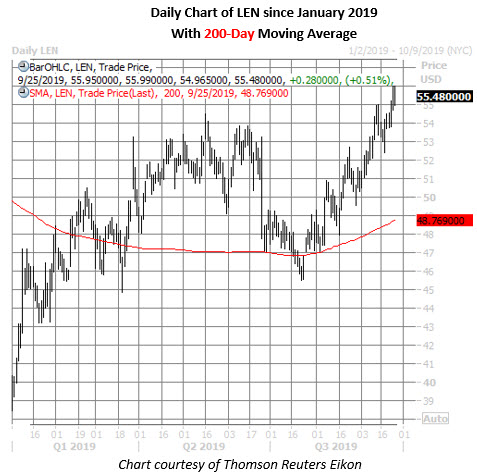
Lennar (NYSE:LEN), meanwhile, will report earnings the morning of Wednesday, Oct. 2. LEN shares have gained 0.5% today to trade at $55.48. The security rallied sharply after taking a strong bounce off familiar support at its 200-day trendline, and yesterday tagged $56.05 -- its highest perch since July 2018.
LEN options traders have grown increasingly bullish ahead of earnings, too. At the ISE, Cboe Options Exchange (CBOE), and NASDAQ OMX PHLX (PHLX), the stock's 10-day call/put volume ratio of 7.23 registers in the 86th annual percentile, meaning calls have been bought to open over puts at an accelerated pace.

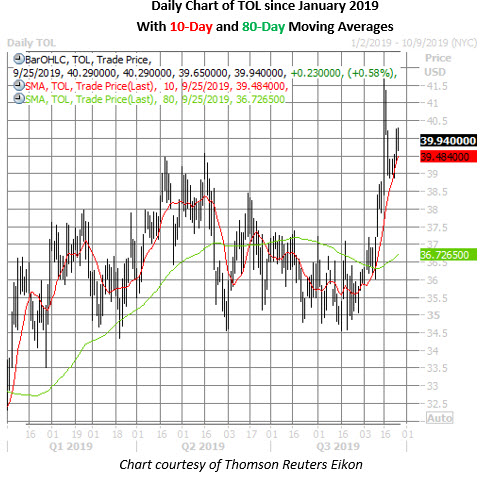
While Toll Brothers earnings aren't expected until early December, the outperforming equity was still included in Raymond James' bullish roundup. As a result, TOL shares are up 0.6% at $39.94, and have gained more than 21% in 2019. The stock's 80-day moving average served as a springboard earlier this month, while its 10-day trendline caught a recent pullback from its Sept. 16 15-month peak at $41.70.
Nevertheless, the majority of the 12 analysts covering TOL stock maintain a "hold" or worse rating, and the average 12-month price target of $38.69 is a discount to current levels. Additionally, the equity's short interest-to-float ratio is perched at 3.5, meaning it would take shorts almost four days to cover, at the average pace of trading. More bull notes and/or some short covering could keep the wind at Toll Brothers' back.

