🐂 Not all bull runs are created equal. November’s AI picks include 5 stocks up +20% eachUnlock Stocks

INTL FCStone Inc Daily Elliott Wave Analysis

Published 01/31/2017, 07:40 PM
Updated 03/09/2019, 08:30 AM
SNEX
-
DXY
-

This is a daily Elliott Wave analysis of the aforementioned company. Firstly, I will mention some of the company’s past history and merger. INTL FCStone Inc (NASDAQ:INTL) is a Fortune 500 financial services industry firm listed on the Nasdaq exchange.

The company has offices worldwide and is headquartered in New York City. This company was founded in 1978 and was known as the Farmers Commodities Corporation until 2002. The company went public with a stock offering in 2007. FCStone Group Inc. and the International Assets Holding Corporation merged in 2009 to form the current INTL FCStone Inc.

There is a stock price history back until 1995 that shows a nice uptrend. In 2016, according to Bloomberg rankings, it was the #1 market maker in 2016 for international securities traded over-the-counter. Also, it was ranked #1 by dollar value for approximately 2,500 securities.

Secondly, as for the Elliott Wave analysis shown below, the focus is in the nearer term from the February 11th, 2016 lows at 24.27. The larger degree cycle highs and lows of the stock are consistent with the US indices high and low cycle troughs and peaks. I would figure as long as this company’s balance sheets remain favorable it would continue to progress higher.

To conclude, from the 2/11/2016 lows, the stock is showing an uptrend still and appears to have ended an impulse cycle up on the 13th of December at 44.71. From there, the stock has declined in three swings to 36.02 on 1/20/2017. There is a chance this is all part of a correction of the cycle up from 2/11/2016 lows. However, until or unless it shows it will break above to new highs again by the time it reaches the 40.30-41.34 Fibonacci retracement area, it should see one more swing lower to correct the cycle up from 2/11/2016 before continuing the uptrend.

INTL Daily Chart
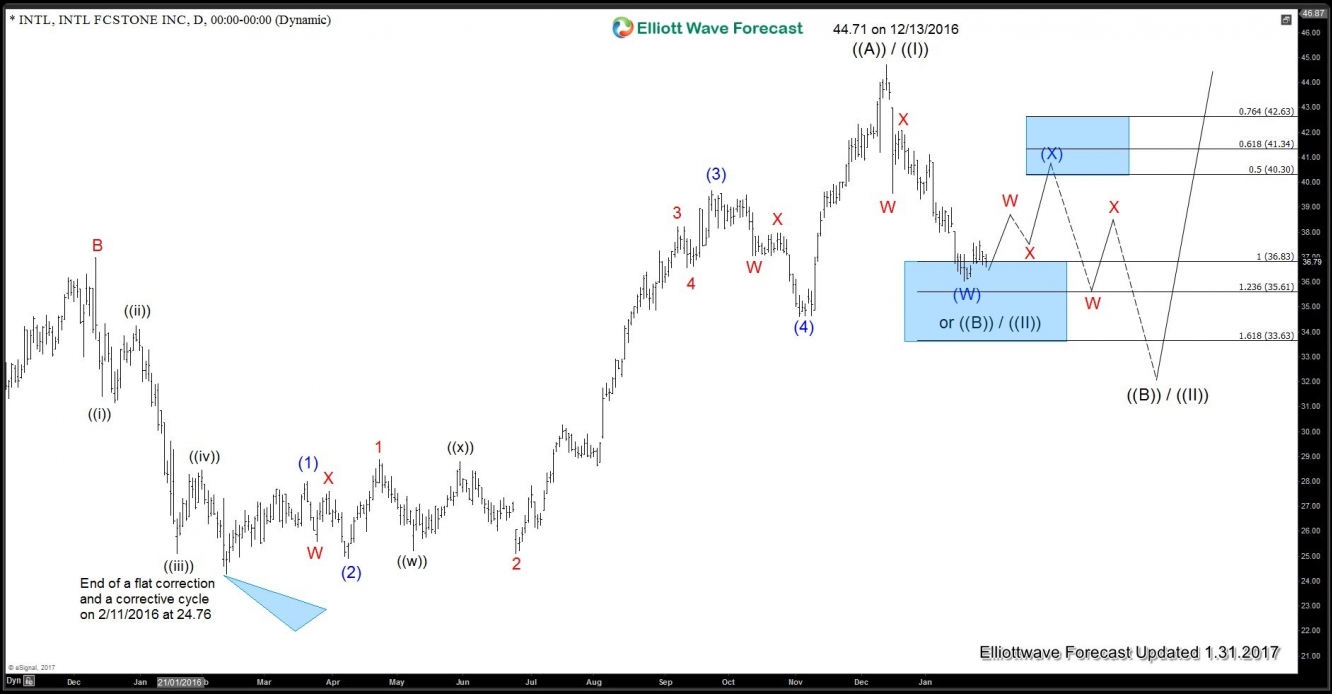
INTL Daily Chart

Latest comments

Loading next article…
Risk Disclosure: Trading in financial instruments and/or cryptocurrencies involves high risks including the risk of losing some, or all, of your investment amount, and may not be suitable for all investors. Prices of cryptocurrencies are extremely volatile and may be affected by external factors such as financial, regulatory or political events. Trading on margin increases the financial risks.
Before deciding to trade in financial instrument or cryptocurrencies you should be fully informed of the risks and costs associated with trading the financial markets, carefully consider your investment objectives, level of experience, and risk appetite, and seek professional advice where needed.
Fusion Media would like to remind you that the data contained in this website is not necessarily real-time nor accurate. The data and prices on the website are not necessarily provided by any market or exchange, but may be provided by market makers, and so prices may not be accurate and may differ from the actual price at any given market, meaning prices are indicative and not appropriate for trading purposes. Fusion Media and any provider of the data contained in this website will not accept liability for any loss or damage as a result of your trading, or your reliance on the information contained within this website.
It is prohibited to use, store, reproduce, display, modify, transmit or distribute the data contained in this website without the explicit prior written permission of Fusion Media and/or the data provider. All intellectual property rights are reserved by the providers and/or the exchange providing the data contained in this website.
Fusion Media may be compensated by the advertisers that appear on the website, based on your interaction with the advertisements or advertisers.
© 2007-2024 - Fusion Media Limited. All Rights Reserved.