The China growth story has been an underlying assumption of investment analysis for the last 20 years. No more. Recent gyrations in the Shanghai stock market finally cemented this development in the public consciousness. Ripples from the decline in Chinese manufacturing are already moving through the world economy. In their most recent minutes, the RBA again noted Australia suffers from economic slack, largely due to the sharp drop in raw material capital investment. The ECB lowered growth forecasts due to declining trade with developing economies. Canada – an economy dependent on raw material exports – entered a technical recession this week. And emerging market currencies continued declining as money left these regions.
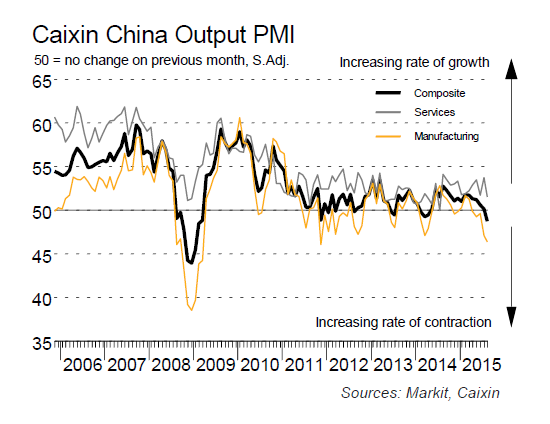
On Monday, Markit reported a 47.1 manufacturing PMI for China. Most importantly, the release noted, “the PMI has now posted below the neutral 50.0 value for six successive months, with the latest deterioration in operating conditions the sharpest since March 2000.” The last, emboldened clause grabbed the market’s attention, sending major equity indexes down sharply. Some commentators responded by arguing the financial press was missing the bigger story – China’s conversion from a manufacturing to service economy. This argument is based on the service sector PMI in isolation; it falls short when the manufacturing and service aggregates are considered:
In their policy statement keeping rates unchanged, the RBA noted the below trend pace of Australian growth:
In Australia, most of the available information suggests that moderate expansion in the economy continues. While growth has been somewhat below longer-term averages for some time, it has been accompanied with somewhat stronger growth of employment and a steady rate of unemployment over the past year. Overall, the economy is likely to be operating with a degree of spare capacity for some time yet, with domestic inflationary pressures contained. Inflation is thus forecast to remain consistent with the target over the next one to two years, even with a lower exchange rate.
Tuesday’s .2% Y/Y GDP growth rate confirmed the softness. In other releases, the AIG manufacturing index showed expansion for a second consecutive month. But the three month average has been consistently below 50 for nearly two years:
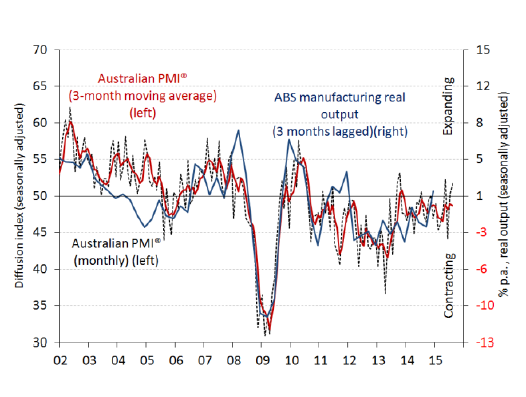
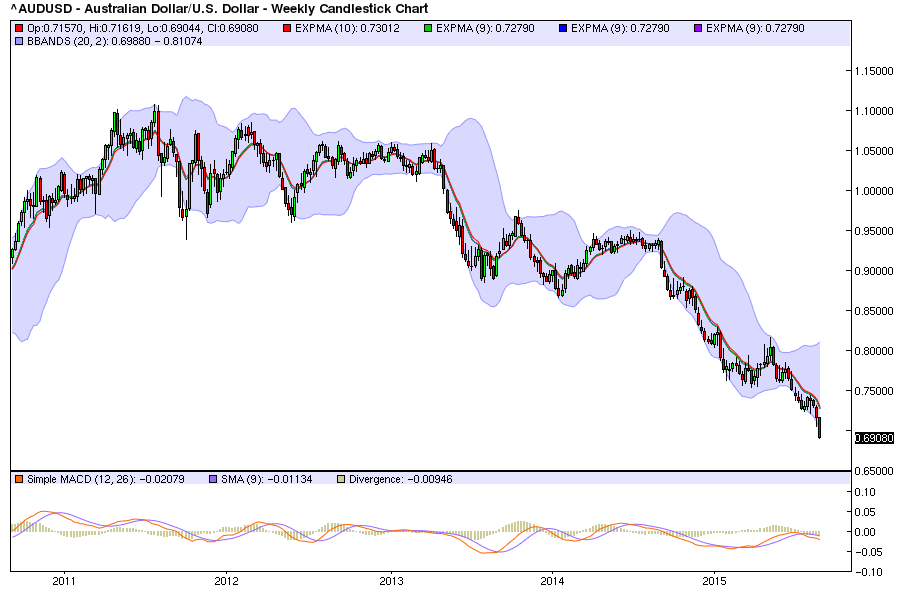
The report also stated overall capacity utilization was 71.3%. To illustrate Australian CU weakness, the US’ utilization is currently 78%. The AUD/USD chart highlights Australian weakness, especially in the 25% decline since 2H14:
While euroarea news continues improving, the latest ECB projections highlight increasing downside risk from balance sheet adjustments, the emerging market slowdown and deflationary pressures:
Underlying our monetary policy assessment was a review of recent data, new staff macroeconomic projections and an interim evaluation of recent market fluctuations. The information available indicates a continued though somewhat weaker economic recovery and a slower increase in inflation rates compared with earlier expectations. More recently, renewed downside risks have emerged to the outlook for growth and inflation. However, owing to sharp fluctuations in financial and commodity markets, the Governing Council judged it premature to conclude on whether these developments could have a lasting impact on the outlook for prices and on the achievement of a sustainable path of inflation towards our medium-term aim, or whether they should be considered to be mainly transitory.
Let me now explain our assessment of the available information in greater detail, starting with the economic analysis. Real GDP in the euroarea rose by 0.3% in the second quarter of 2015, which was somewhat lower than previously expected. The latest survey indicators point to a broadly similar pace of real GDP growth in the second half of this year. Overall, we expect the economic recovery to continue, albeit at a somewhat weaker pace than earlier expected, reflecting in particular the slowdown in emerging market economies, which is weighing on global growth and foreign demand for euro area exports. Domestic demand should be further supported by our monetary policy measures and their favourable impact on financial conditions, as well as by the progress made with fiscal consolidation and structural reforms. Moreover, the decline in oil prices should provide support for households’ real disposable income and corporate profitability and, therefore, private consumption and investment. However, economic growth in the euro area is likely to continue to be dampened by the necessary balance sheet adjustments in a number of sectors and the sluggish pace of implementation of structural reforms
This assessment is also broadly reflected in the September 2015 ECB staff macroeconomic projections for the euro area, which foresee annual real GDP increasing by 1.4% in 2015, 1.7% in 2016 and 1.8% in 2017. Compared with the June 2015 Eurosystem staff macroeconomic projections, the outlook for real GDP growth has been revised down, primarily due to lower external demand owing to weaker growth in emerging markets.
Paying down debt is the only internal EU event slowing growth. Externally, the ECB is focused on the emerging market slowdown and its negative impact on EU trade. Finally, the central bank is acknowledging the potential deflationary threat. It appears they’re hoping lower oil prices will sufficiently increase consumption to counter-balance price declines. Draghi also put the possibility of additional QE measures on the table:
Accordingly, the Governing Council will closely monitor all relevant incoming information. It emphasises its willingness and ability to act, if warranted, by using all the instruments available within its mandate and, in particular, recalls that the asset purchase programme provides sufficient flexibility in terms of adjusting the size, composition and duration of the programme.
In the meantime, we will fully implement our monthly asset purchases of €60 billion. These purchases have a favourable impact on the cost and availability of credit for firms and households. They are intended to run until the end of September 2016, or beyond, if necessary, and, in any case, until we see a sustained adjustment in the path of inflation that is consistent with our aim of achieving inflation rates below, but close to, 2% over the medium term.
The above paragraphs contain several key phrases: “if warranted” and “or beyond, if necessary” depending on inflation.
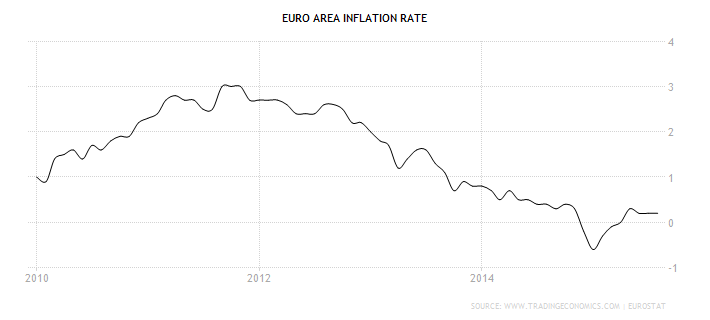
EU inflation is uncomfortably low. This week’s .2% Y/Y inflation rate is far below the ECB’s 2% mandate. As shown in the following graph, price pressures are non-existent and may be approaching deflationary levels:
Other EU news was positive. Unemployment decreased .2% to 10.9% and retail sales increased .4% continuing this data sets upward trajectory. Both the manufacturing and services sectors continue expanding, with PMI readings of 52.2 and 54.7, respectively.
The only meaningful news for the UK was the complete battery of releases from Markit. The services sector was 55.6. The report made a great deal about this number printing below any forecast. But considering the overall strength of this sector, that criticism seems unimportant. The construction number was 57.3, with residential and commercial coming in strong. Civil was positive but weak. Manufacturing’s 51.5 headline number belies underlying weakness; only consumer goods production is providing meaningful gains:
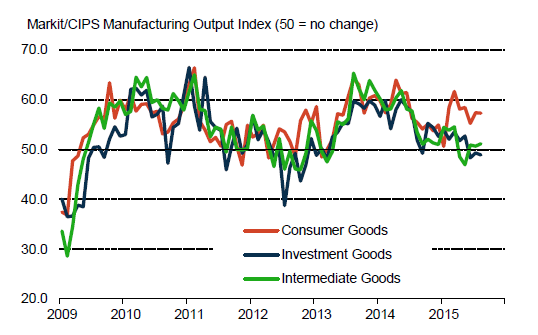
Investment and intermediate goods are weak due to the strong sterling:
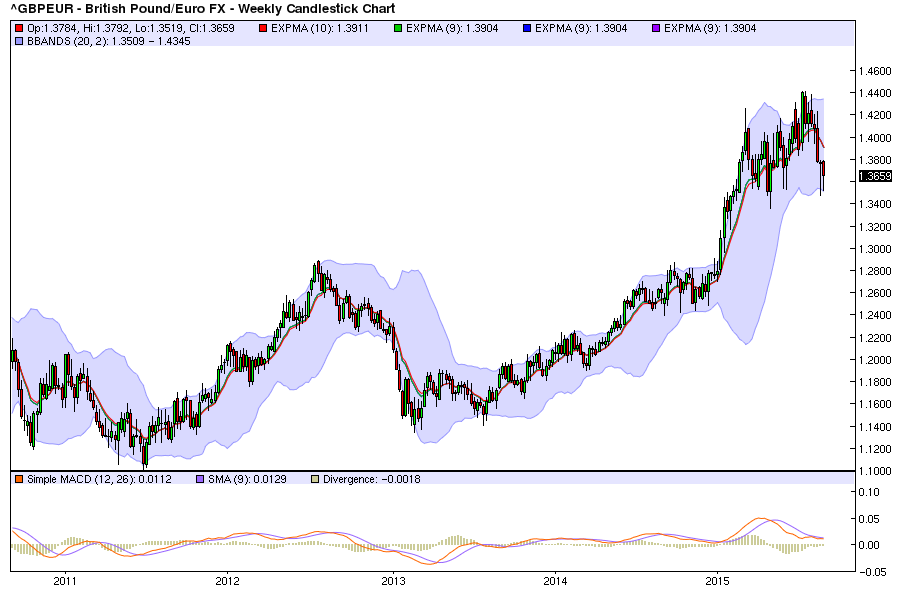
For the first half of the year, the BOE and Fed were in a race to be first to increase interest rates. The BOE is now trailing the Fed, largely because the sterling is doing the BOE’s work. In addition – and like other countries – low inflation is spooking central bankers.
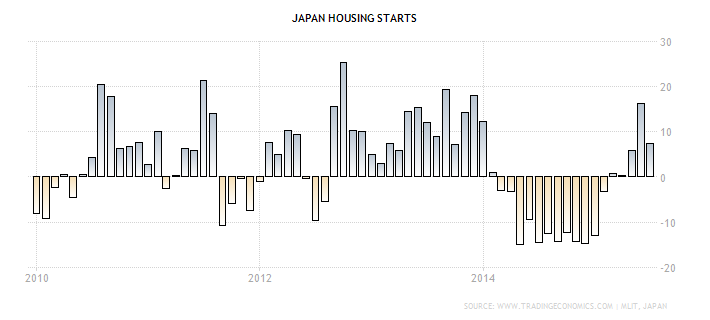
Japanese Service PMI was the highest in 22 months, printing at 53.7; new orders were the second highest of the year. Manufacturing’s overall PMI was 51.7, thanks to a sharp increase in new orders. And housing starts were up 7.4% Y/Y; this marks the third consecutive month of strong Y/Y numbers. However, housing starts contracted sharply for the 2H14 and 1H15:
As I noted earlier this week, Canada is now in a technical recession. The markets responded positively to the Canadian employment report, focusing on the gain of 12,000. But the unemployment rate also increased .2% to 7%. This is more in line with a weakening economy and certainly not healthy.
US news will be covered in the US Equity and Economic Review on Sunday.
The potential negative impact of China’s slowdown is sinking into policy maker’s decision making process and trader’s analysis. Money is flowing from emerging to developed economies; emerging markets and currencies are underperformers relative to developed markets. The potential for China to export deflation is being discussed. And central bankers are acknowledging the slowdown by lowering growth forecasts and opening speculating about additional monetary stimulus. As we leave the summer doldrums and enter the last four months of trading, the environment has clearly changed.
