US Treasury 10-year bond yields hit a record low ~0.52% early last August (as gold hit a record high) and then trended higher for several months. This year, the trend accelerated and then surged higher, with the 10-year yield briefly touching 1.61% on Thursday following a dismal 7-year auction. (Bond prices on this chart move inverse to yields.)
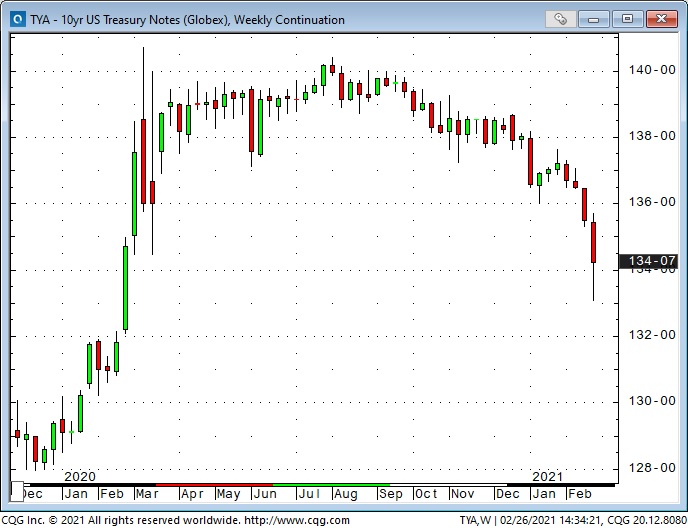
The market is betting on higher inflation
Last week I noted that the market is betting on higher inflation. However, the Fed}and the U.S. President Joseph Biden's administration seem to think that the economy is still struggling and needs HUGE additional monetary and fiscal support. The combination of rising inflation expectations and HUGE additional stimulus creates a fabulous opportunity for a new generation of bond market vigilantes to challenge the Fed.
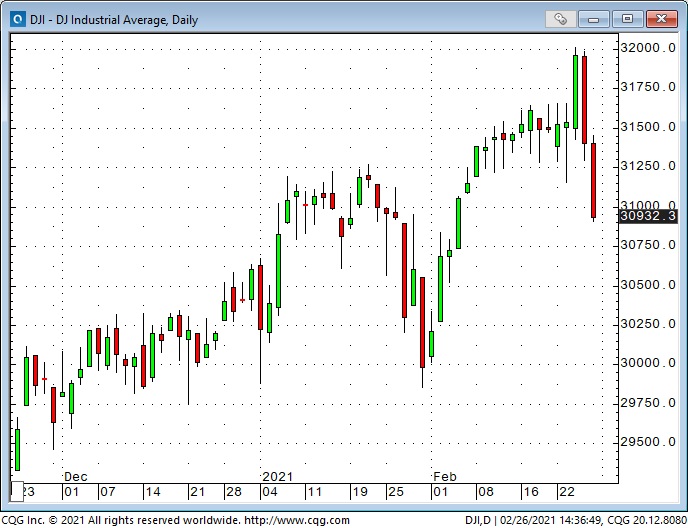
On Wednesday, a remarkably dovish Fed Chair Jerome Powell declared that the Fed would remain ultra-accommodative until unemployment numbers were much lower than present levels. The DJIA surged to new all-time highs on his remarks, but two days later, as bond yields soared, the DJIA was down over 1,000 points.
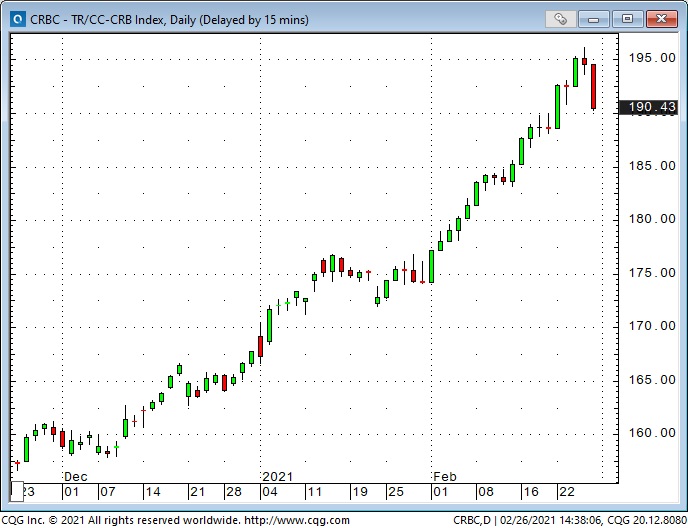
Commodities and commodity currencies suffer sharp reversals as interest rates rise
Commodity indices hit multi-year lows last March/April (after a brutal 10-year bear market) and have rallied strongly as speculators became increasingly aggressive. Last week there were losses across the board, from cotton to lumber to live cattle.
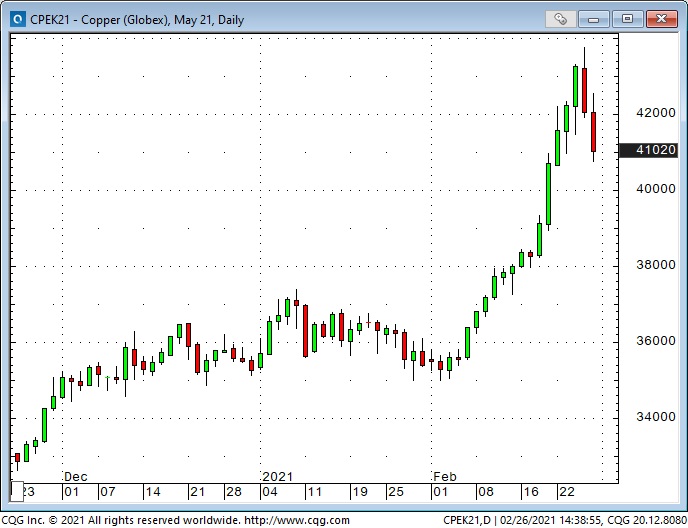
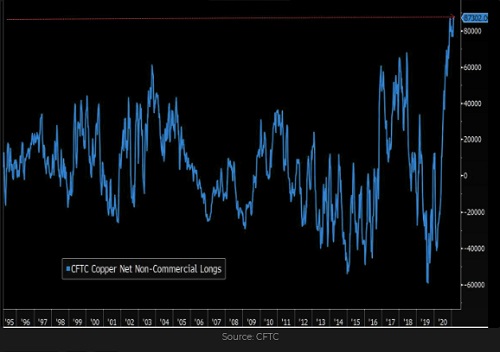
Copper has been bid aggressively higher by commodity speculators and hit 10-year highs this week before tumbling on the interest rate surge. Net long speculative positioning in the futures markets soared to record highs over the past several months as copper prices rallied, leaving this market vulnerable to serious margin call selling if prices keep falling.
This chart shows the fantastic rise to all-time highs in net bullish copper speculative positioning.
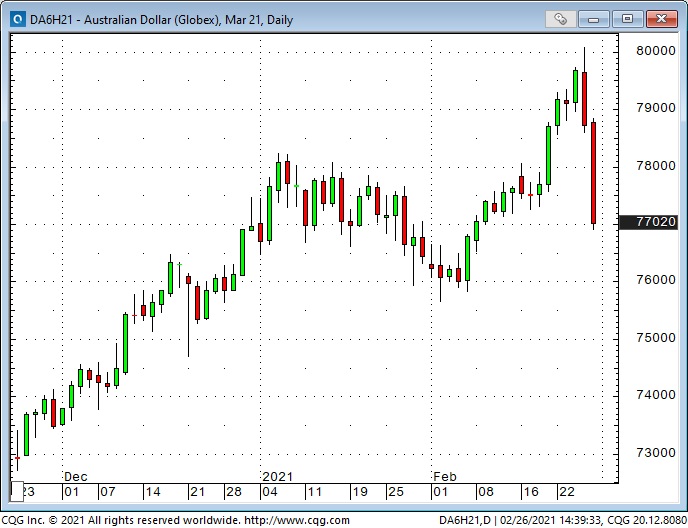
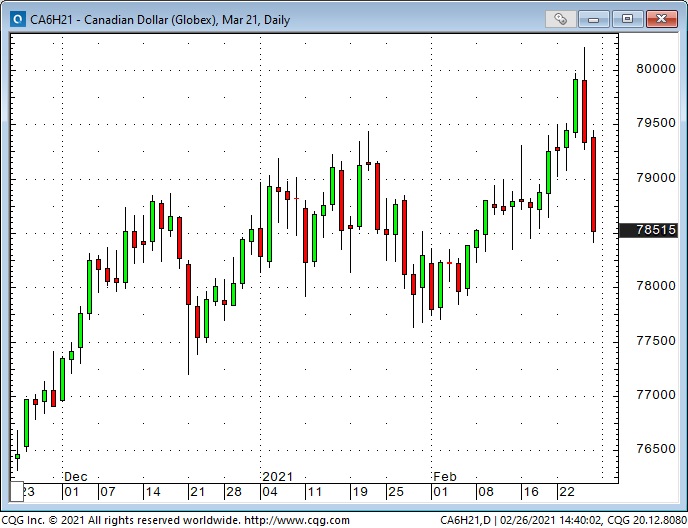
Commodity currencies have had a similar pattern to copper (over the last 10 years and over the last 10 days.). Last week the major com-dols, such as the Australian and Canadian dollars, hit 3-year highs but reversed sharply as interest rates soared.
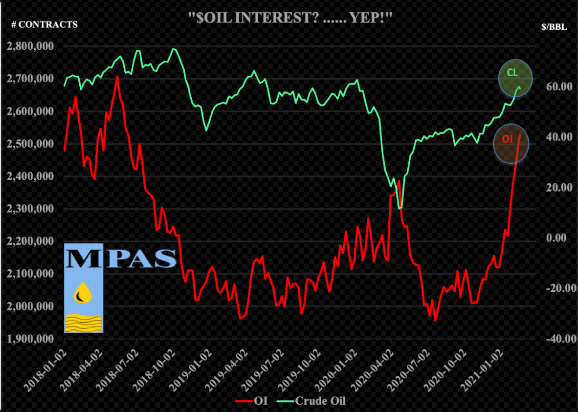
WTI crude oil has had a spectacular rally since early November rising from around $34 to nearly $64 this week. Open interest has surged ~25% as speculators anticipate a supply/demand imbalance once global economies re-open.
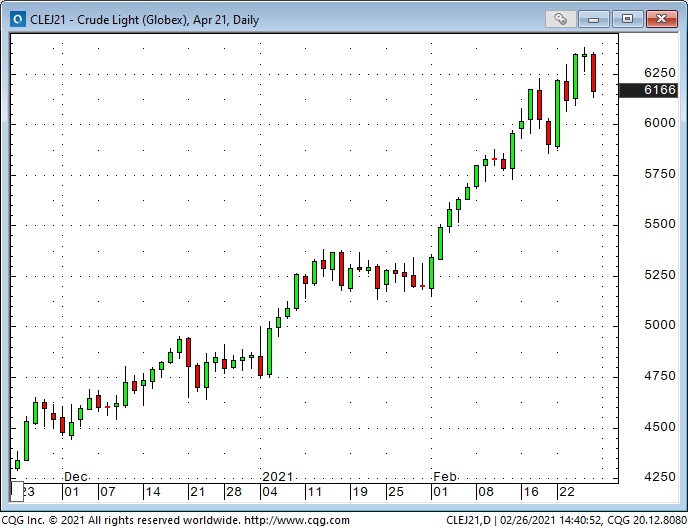
The red line on this chart shows the very steep increase in open interest (total positioning) in WTI over the past few months as crude prices rallied. So far, crude has sustained its price gains, but if prices start to fall, the decline may be accelerated by liquidation (forced or otherwise.)
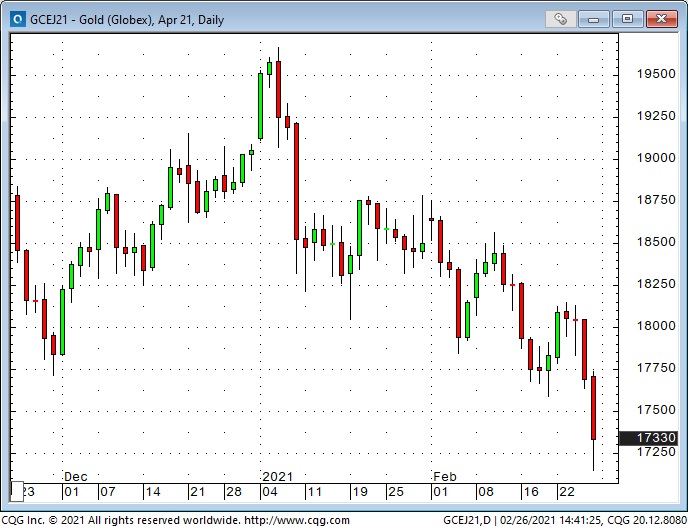
Gold was down as much as $200 from its January highs last week as real interest rates surged higher. Gold ETF (NYSE:GLD) buying was a major contributor to gold’s rise to record highs last year, but ETF sales have pressured prices this year.
Several other markets that experienced steep speculative rallies over the past few months, like ARK Innovation (NYSE:ARKK) and iShares MSCI Emerging Markets ETF (NYSE:EEM) also suffered reversals last week as markets started 'de-risking.'
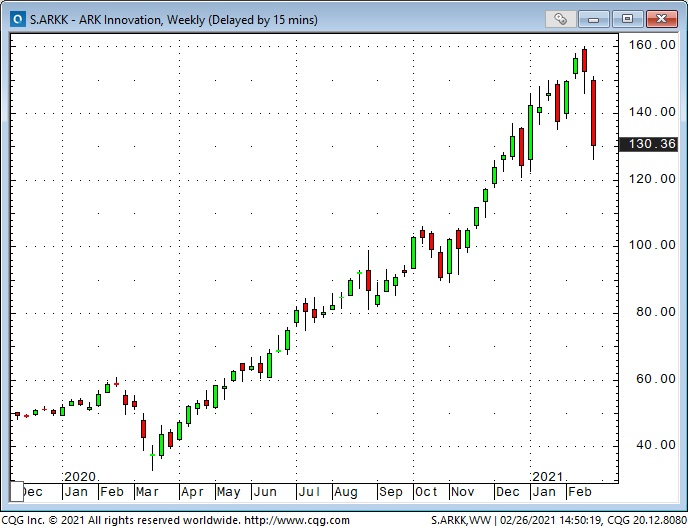
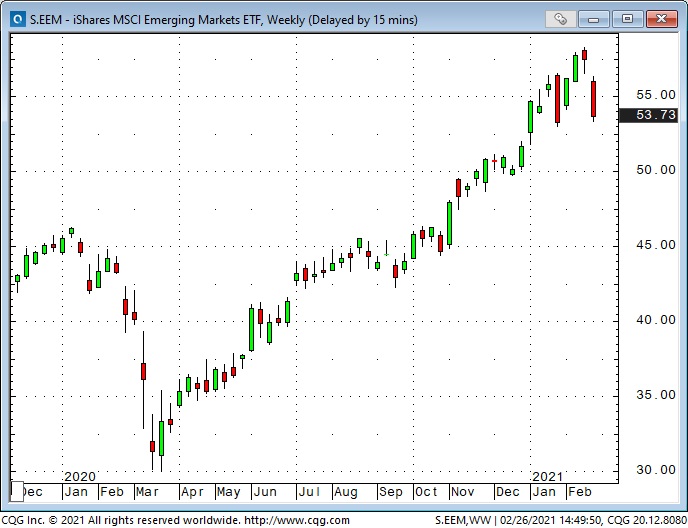
Dramatic price action across markets last week may have signaled an important sea-change in investor behavior.
Price action across markets last week may have created another Key Turn Date. (A KTD is when several different markets all reverse direction around the same time—signifying that 'something' important happened on that date.)
Since December, I’ve thought that the pro-risk trade (long stocks and commodities, short the USD) had run WAY too far on speculative excesses and was at risk of a significant correction. I thought the turn higher in the USD in early January might precipitate a correction in stocks and commodities, but I was wrong, or early, which is the same thing as being wrong in my business!
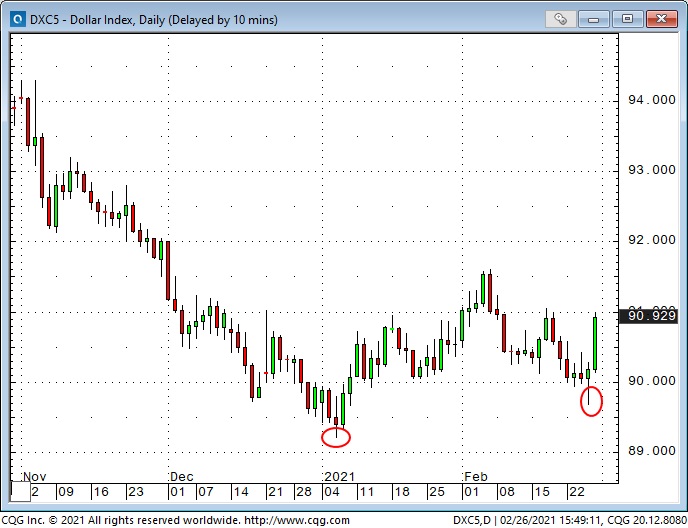
However, the USD made a 'higher low' last week (2nd circle on the chart) and that, together with the sharp jump in interest rates may lead to a 'purge' of some of the speculative excesses that have built up across markets over the past few months.
My short term trading
I made good net gains this week shorting stock indices and the Canadian dollar. I was stopped out of the bearish WTI time spread I established last week but I re-entered the trade Friday looking for WTI to weaken like other commodities.
Price action was very choppy across markets last week with lots of HUGE intra-day moves. Volumes were HUGE in many markets. It feels like the 'complacency' of 'one-way' markets is gone, and things will get a LOT more emotional.
