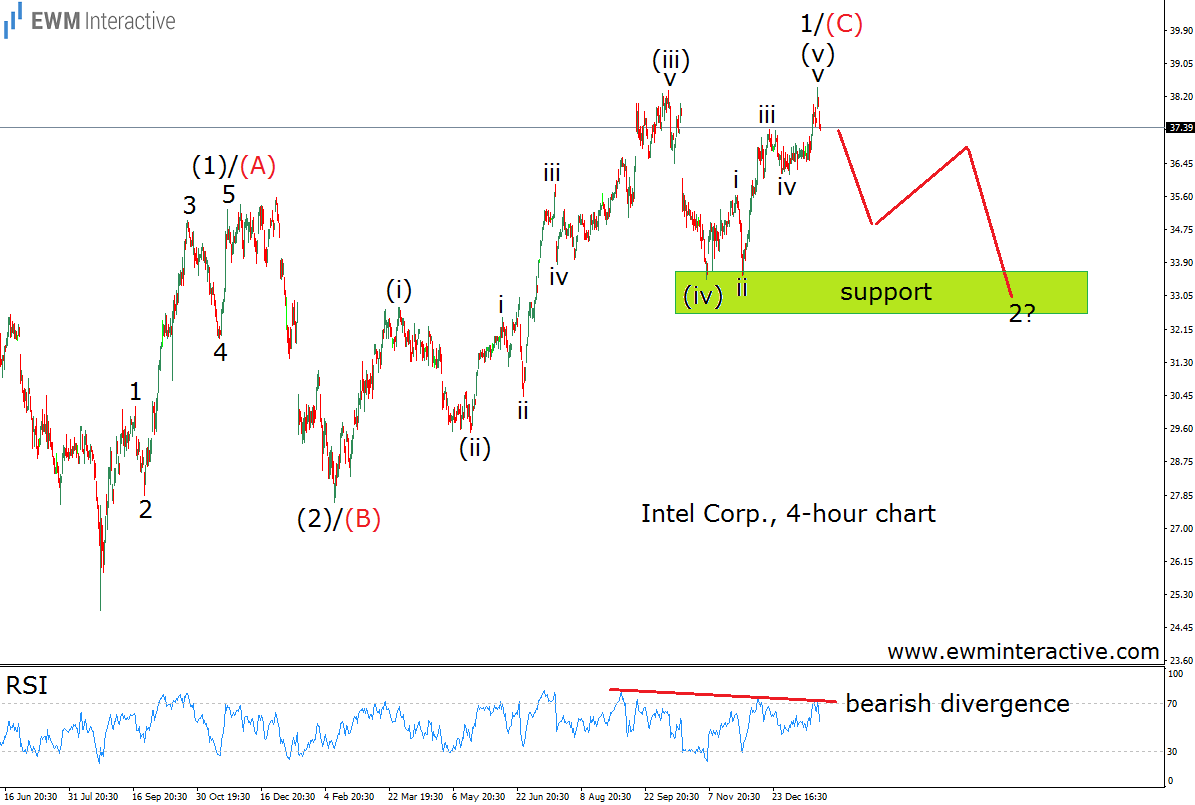
“Another decline at least to the support area near $34 – $33 might be underway.” That is what the Elliott Wave Principle suggested about the share price of Intel Corp (NASDAQ:INTC). back on January 31st. While the stock was trading at $37.40 over six months ago, we published an article to show you the following chart.

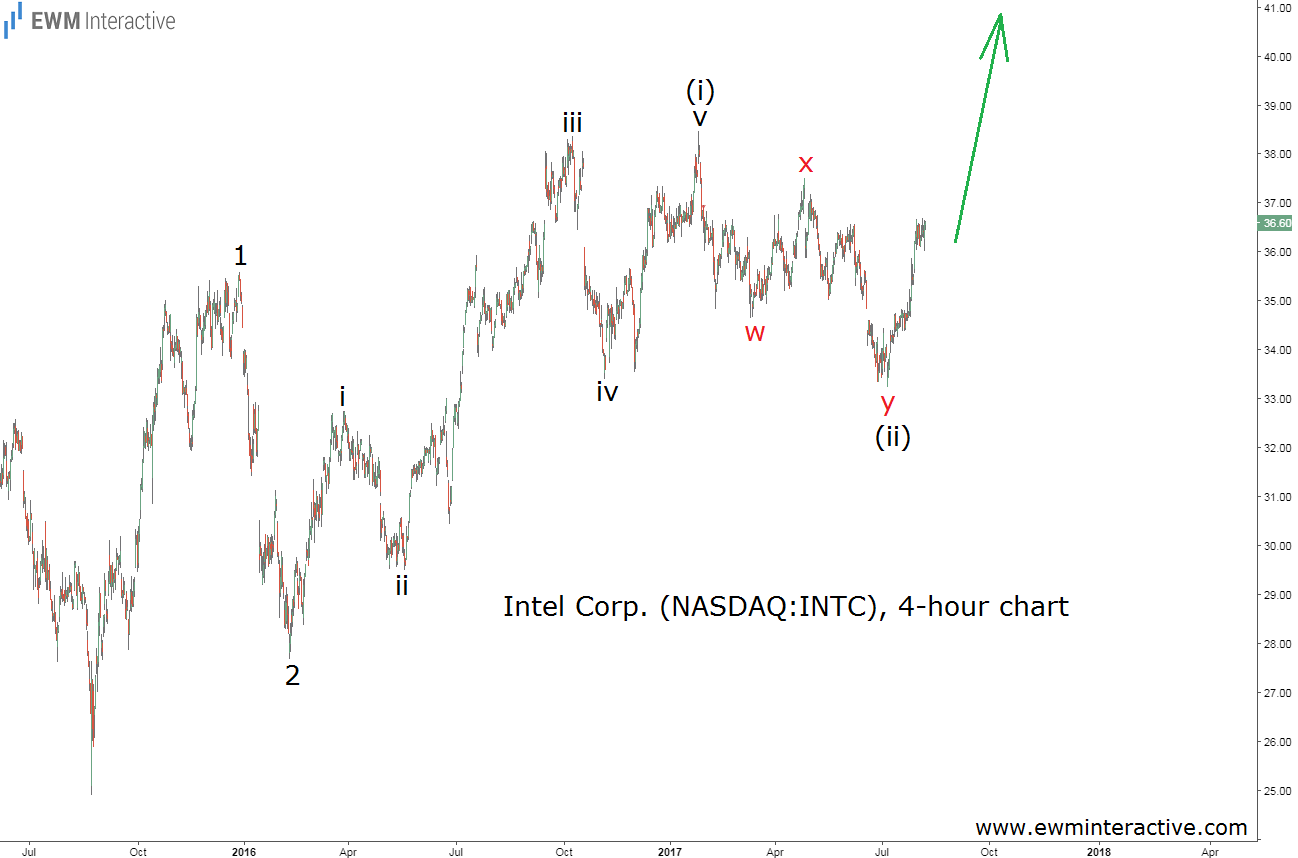
Despite the fact that Intel stock had just reached a new multi-year high, a five-wave impulse pattern accompanied by a bearish divergence with the RSI suggested the bears were going to drag the price down to the support of the previous fourth wave, before the uptrend could resume. In case you have not been following Intel’s story, here is how its price chart looks like today, August 10th.

Prices started declining almost immediately. Last month, the stock fell to as low as $33.25, only to bounce back up from the support of wave iv and climb to $36.63 as of yesterday’s close. If this is the correct count, the bulls should take the wheel from now on and lift Intel stock to territories not seen since the Dot-com bust. How high could the rally be expected to go? As you may have noticed, the updated 4-hour chart was not labeled in the exactly same way as the one we showed you in January. That is because this time we are going to take a look at the bigger picture.

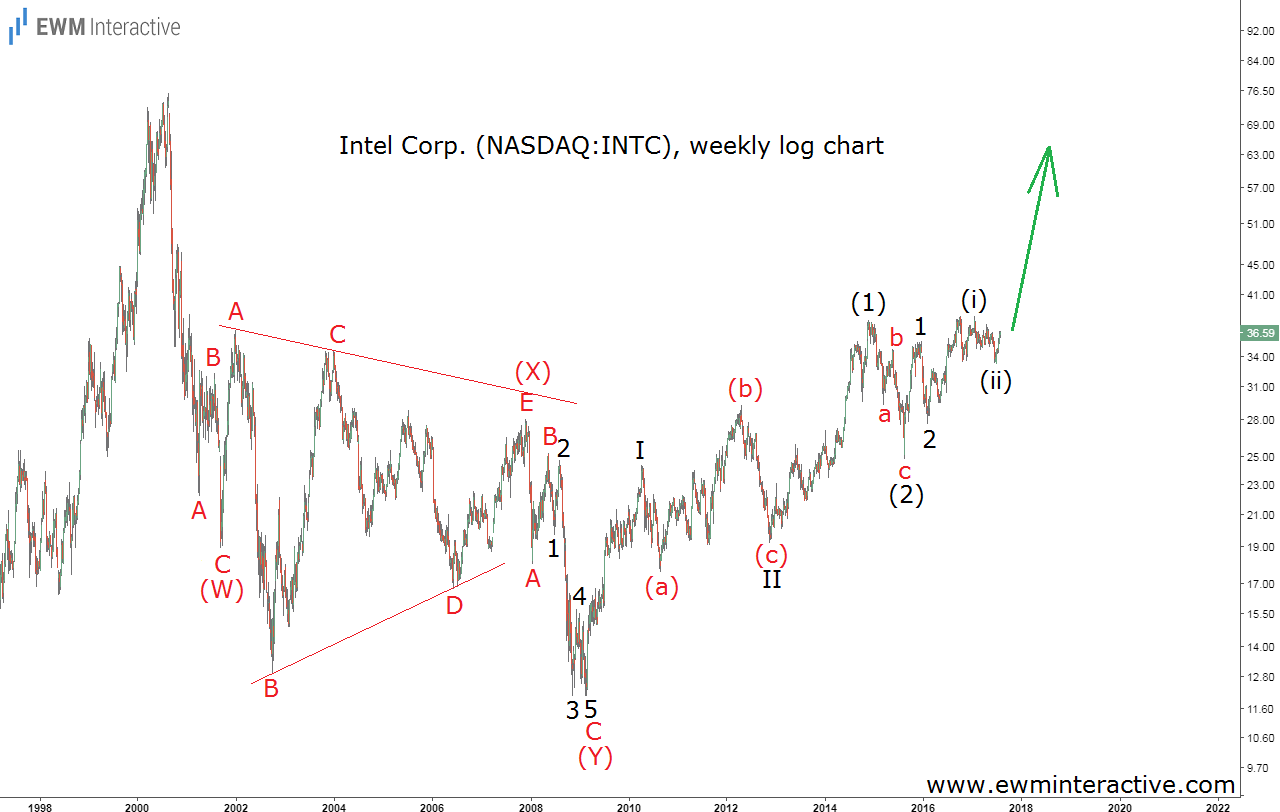
It looks promising, doesn’t it? The weekly chart allows us to see Intel’s entire stock price history since the peak of the Dot-com bubble in late-2000, when it topped at $75.81 a share. By March, 2009, Intel was down 84% to as low as $12.07. What matters to us as Elliott Wave analysts is the structure of this plunge. It looks like a textbook three-wave correction in the form of a (W)-(X)-(Y) double zig-zag, where wave (X) is a triangle. In theory, once a correction ends, the larger trend resumes. In practice, once Intel’s double zig-zag retracement found a bottom in 2009, the uptrend resumed.
Furthermore, judging from the wave structure of the post-2009 advance, the bulls might be just getting warmed up. The recovery from $12.07 to $38.45 could be seen as a series of first and second waves, which means the strongest part of the impulsive rally – wave (iii) of 3 of (3) of III – should be expected from now on. If this count is correct, INTC is going to be an outperformer in the next several years. In the long-term, the stock could finally return to its dot-com glory.
