Facebook (NASDAQ:FB) raised more than a few eyebrows when it announced it was paying $1 billion for Instagram four years ago, but now it’s looking like that was a smart investment. Not only has the photo-centric social network begun attracting more ad dollars than Twitter, but more data indicates that adoption among direct response advertisers has soared.
Marketers recognizing the value of Instagram
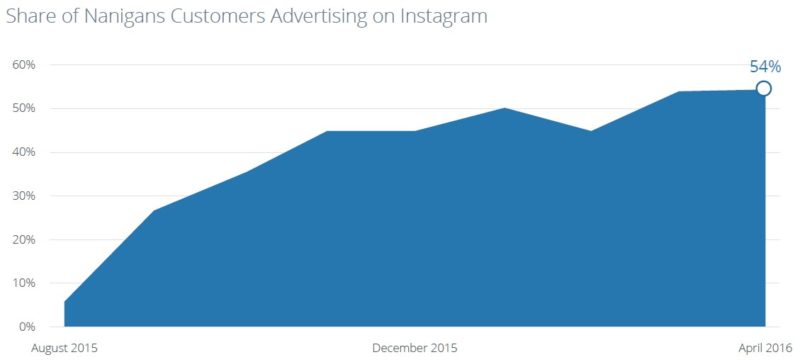
In its June 2016 “Instagram Advertising Benchmark Report,” Nanigans reports that now more than half of its customers were advertising on Instagram as of April.

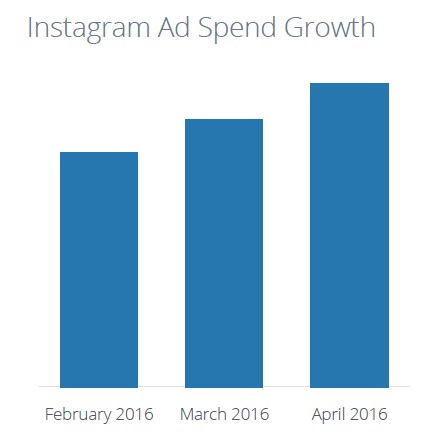
The firm adds that adoption of advertising on Instagram has increased along with the size of ad budgets. According to Nanigans, the average size of ad spend on Instagram grew 29% from February to April.

“With rising budgets, Instagram is cementing its position as a core channel for digital advertisers powering growth on mobile,” the firm states in its benchmark report. “This trend is the result of strong performance, rapid innovation in direct response ad products, and the ability to use Facebook’s familiar targeting capabilities to quickly scale growth and ROI.”
Nanigans also reports that e-commerce advertisers are seeing especially great success with their ad spend on Instagram as it offers them a way to visually promote their products and services “in a highly compelling way.” According to the firm, its top-spending e-commerce customers saw a 62% increase in the return on their Instagram ad spend when looking at the August to October 2015 and February to April 2016 timeframes.
Instagram versus FB
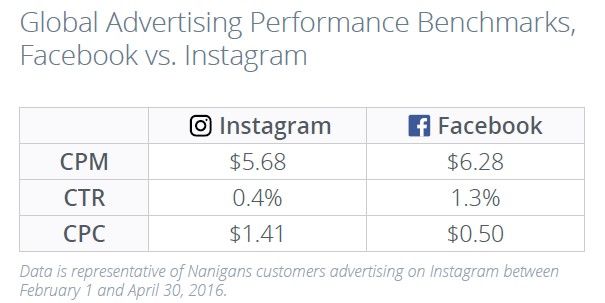
The firm also compared the performance of its advertisers on Instagram and its parent company Facebook. Nanigans looked at its clients that advertised on both social networks over the same period of time. To compare the performance of its various clients, the firm looked at click-through rate, cost per thousand impressions, and cost per click, and the results of its analysis turned to be quite interesting.

Instagram innovates in ad products
Analysts discovered that in the first four months of this year, cost per thousand impressions on Instagram was fairly stable with what was seen six months before with only a 2% decline. Since the last time Nanigans compiled a report on Instagram, the social network has changed how it calculates ad clicks. It rolled out ad overlays and then changed to count only the clicks that came from users who tapped on the ad overlay link, taking them to the website or app or to the app store or clicks on an ad’s call-to-action button, such as “Install Now” or “Shop Now.” More recently, the social network rolled out a full-width call-to-action button on ads to replace the overlay and previous design.
According to Nanigans, the social network discovered that most clicks came not on the overlay but on the call-to-action button, which now turns blue when a user taps on the image in an ad. The firm states that the new behavior confirms the user’s intent to click through to an advertiser’s website and results in higher-quality clicks because it disregards clicks from those who didn’t take any action, probably because they clicked accidentally. Nanigans sees this as a positive because it will drive a greater return on ad spend.
