Inside A $2.2M Trade On Gold Miners

Published 03/27/2018, 01:19 AM
XAU/USD
-
GC
-
GLD
-
GDX
-

Gold futures are up 0.2% this afternoon to trade at $1,352.20 per ounce, after Goldman Sachs issued a bullish note on the precious metal. The brokerage firm raised its outlook on the EMEA metals and mining sector to "attractive," and said gold looks set to "outperform" amid rising inflation concerns and jitters in the equities market.

Optimism over Goldman's bullish call on bullion has pushed the SPDR Gold Shares (HK:2840) ETF (NYSEARCA:GLD (NYSE:GLD)) up 0.7% to $128.45. Meanwhile, the VanEck Vectors Gold Miners ETF (NYSEARCA:NYSE:GDX) has rallied 1.7% to $22.48, and one options trader today sold premium into the rally.

Shortly after 1:00 PM Eastern, per International Securities Exchange (ISE) data via Trade-Alert, a short straddle was opened on GDX at the January 2019 22 strike. The trader sold 5,000 of the LEAPS calls for $2.58 per contract, and 5,000 of the corresponding puts for $1.79 each. The total net credit on the position is $4.37 for each put/call pair -- which, after accounting for 100 shares per contract and 5,000 straddles sold, shakes out to $2.185 million.

Given that the ISE flags these trades as firm-generated, this isn't necessarily a speculative play on gold miners. In fact, 110,000 GDX shares traded at roughly the same time for $22.44 each, and the transaction appears tied to the short straddles.

For what it's worth, at-the-money implied volatility on the GDX weekly 3/29 strike has jumped 4.7 percentage points today to 29.33%. After this week's expiration, volatilities drop back into the 24-25% range, but gradually rise to 27.63% by the aforementioned January 2019 series. Unlike equity volatility, gold option volatility has historically increased on rallies in gold prices -- so it would seem the options market is, like Goldman, pricing in a bullish long-term forecast for the precious metals sector.

On the charts, GDX topped out at $22.50 earlier -- right in the neighborhood of a recently completed bearish cross by its 50-day and 80-day moving averages.
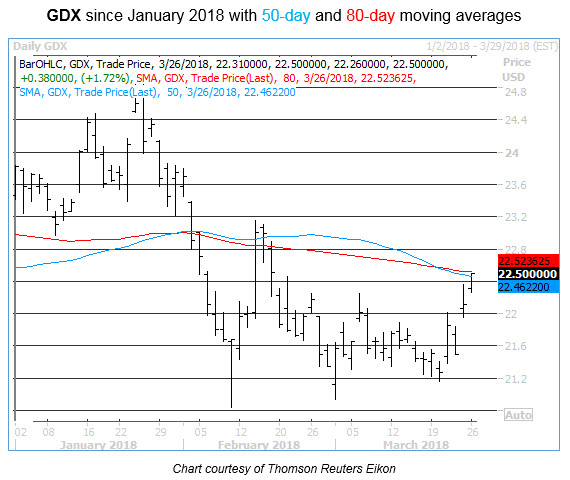
GDX Daily Chart

Latest comments

Loading next article…
Risk Disclosure: Trading in financial instruments and/or cryptocurrencies involves high risks including the risk of losing some, or all, of your investment amount, and may not be suitable for all investors. Prices of cryptocurrencies are extremely volatile and may be affected by external factors such as financial, regulatory or political events. Trading on margin increases the financial risks.
Before deciding to trade in financial instrument or cryptocurrencies you should be fully informed of the risks and costs associated with trading the financial markets, carefully consider your investment objectives, level of experience, and risk appetite, and seek professional advice where needed.
Fusion Media would like to remind you that the data contained in this website is not necessarily real-time nor accurate. The data and prices on the website are not necessarily provided by any market or exchange, but may be provided by market makers, and so prices may not be accurate and may differ from the actual price at any given market, meaning prices are indicative and not appropriate for trading purposes. Fusion Media and any provider of the data contained in this website will not accept liability for any loss or damage as a result of your trading, or your reliance on the information contained within this website.
It is prohibited to use, store, reproduce, display, modify, transmit or distribute the data contained in this website without the explicit prior written permission of Fusion Media and/or the data provider. All intellectual property rights are reserved by the providers and/or the exchange providing the data contained in this website.
Fusion Media may be compensated by the advertisers that appear on the website, based on your interaction with the advertisements or advertisers.
© 2007-2025 - Fusion Media Limited. All Rights Reserved.