A third round of stimulus payments, improving COVID-19 vaccine distributions, and talks of a $2.3 trillion infrastructure package pushed the broad-market indices to their fourth consecutive month of plus-side performance. The average equity fund (including ETFs) experienced a 6.31% return for Q1 2021 and whopping one-year return of 61.39%.
Despite ongoing inflationary concerns, which drove the 10-year Treasury yield up 81 basis points during the first quarter to 1.74%—its highest closing value since Jan. 23, 2020—and President Joe Biden’s plan to raise taxes on corporations and wealthy individuals—investors injected $454 billion into mutual funds and ETFs during Q1, using preliminary numbers.
Fearing an overheated market, a recent rise in coronavirus cases globally, and an increase in market volatility, money market funds (+$185.8 billion) were the main attractor of investors’ assets for the quarter. Nonetheless, investors continued to pad the coffers of long-term assets as well to the tune of $268.2 billion, with taxable bond funds (including ETFs) taking in $133.8 billion, followed by equity funds (+$107.7 billion) and municipal bond funds (+$26.8 billion).
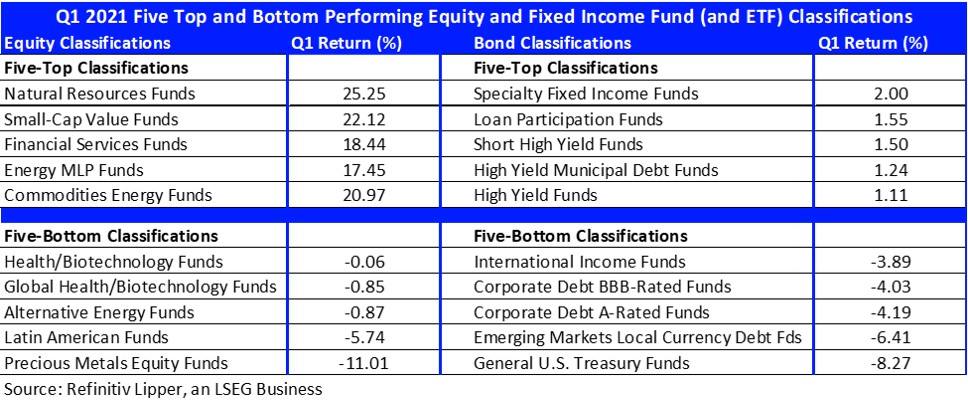
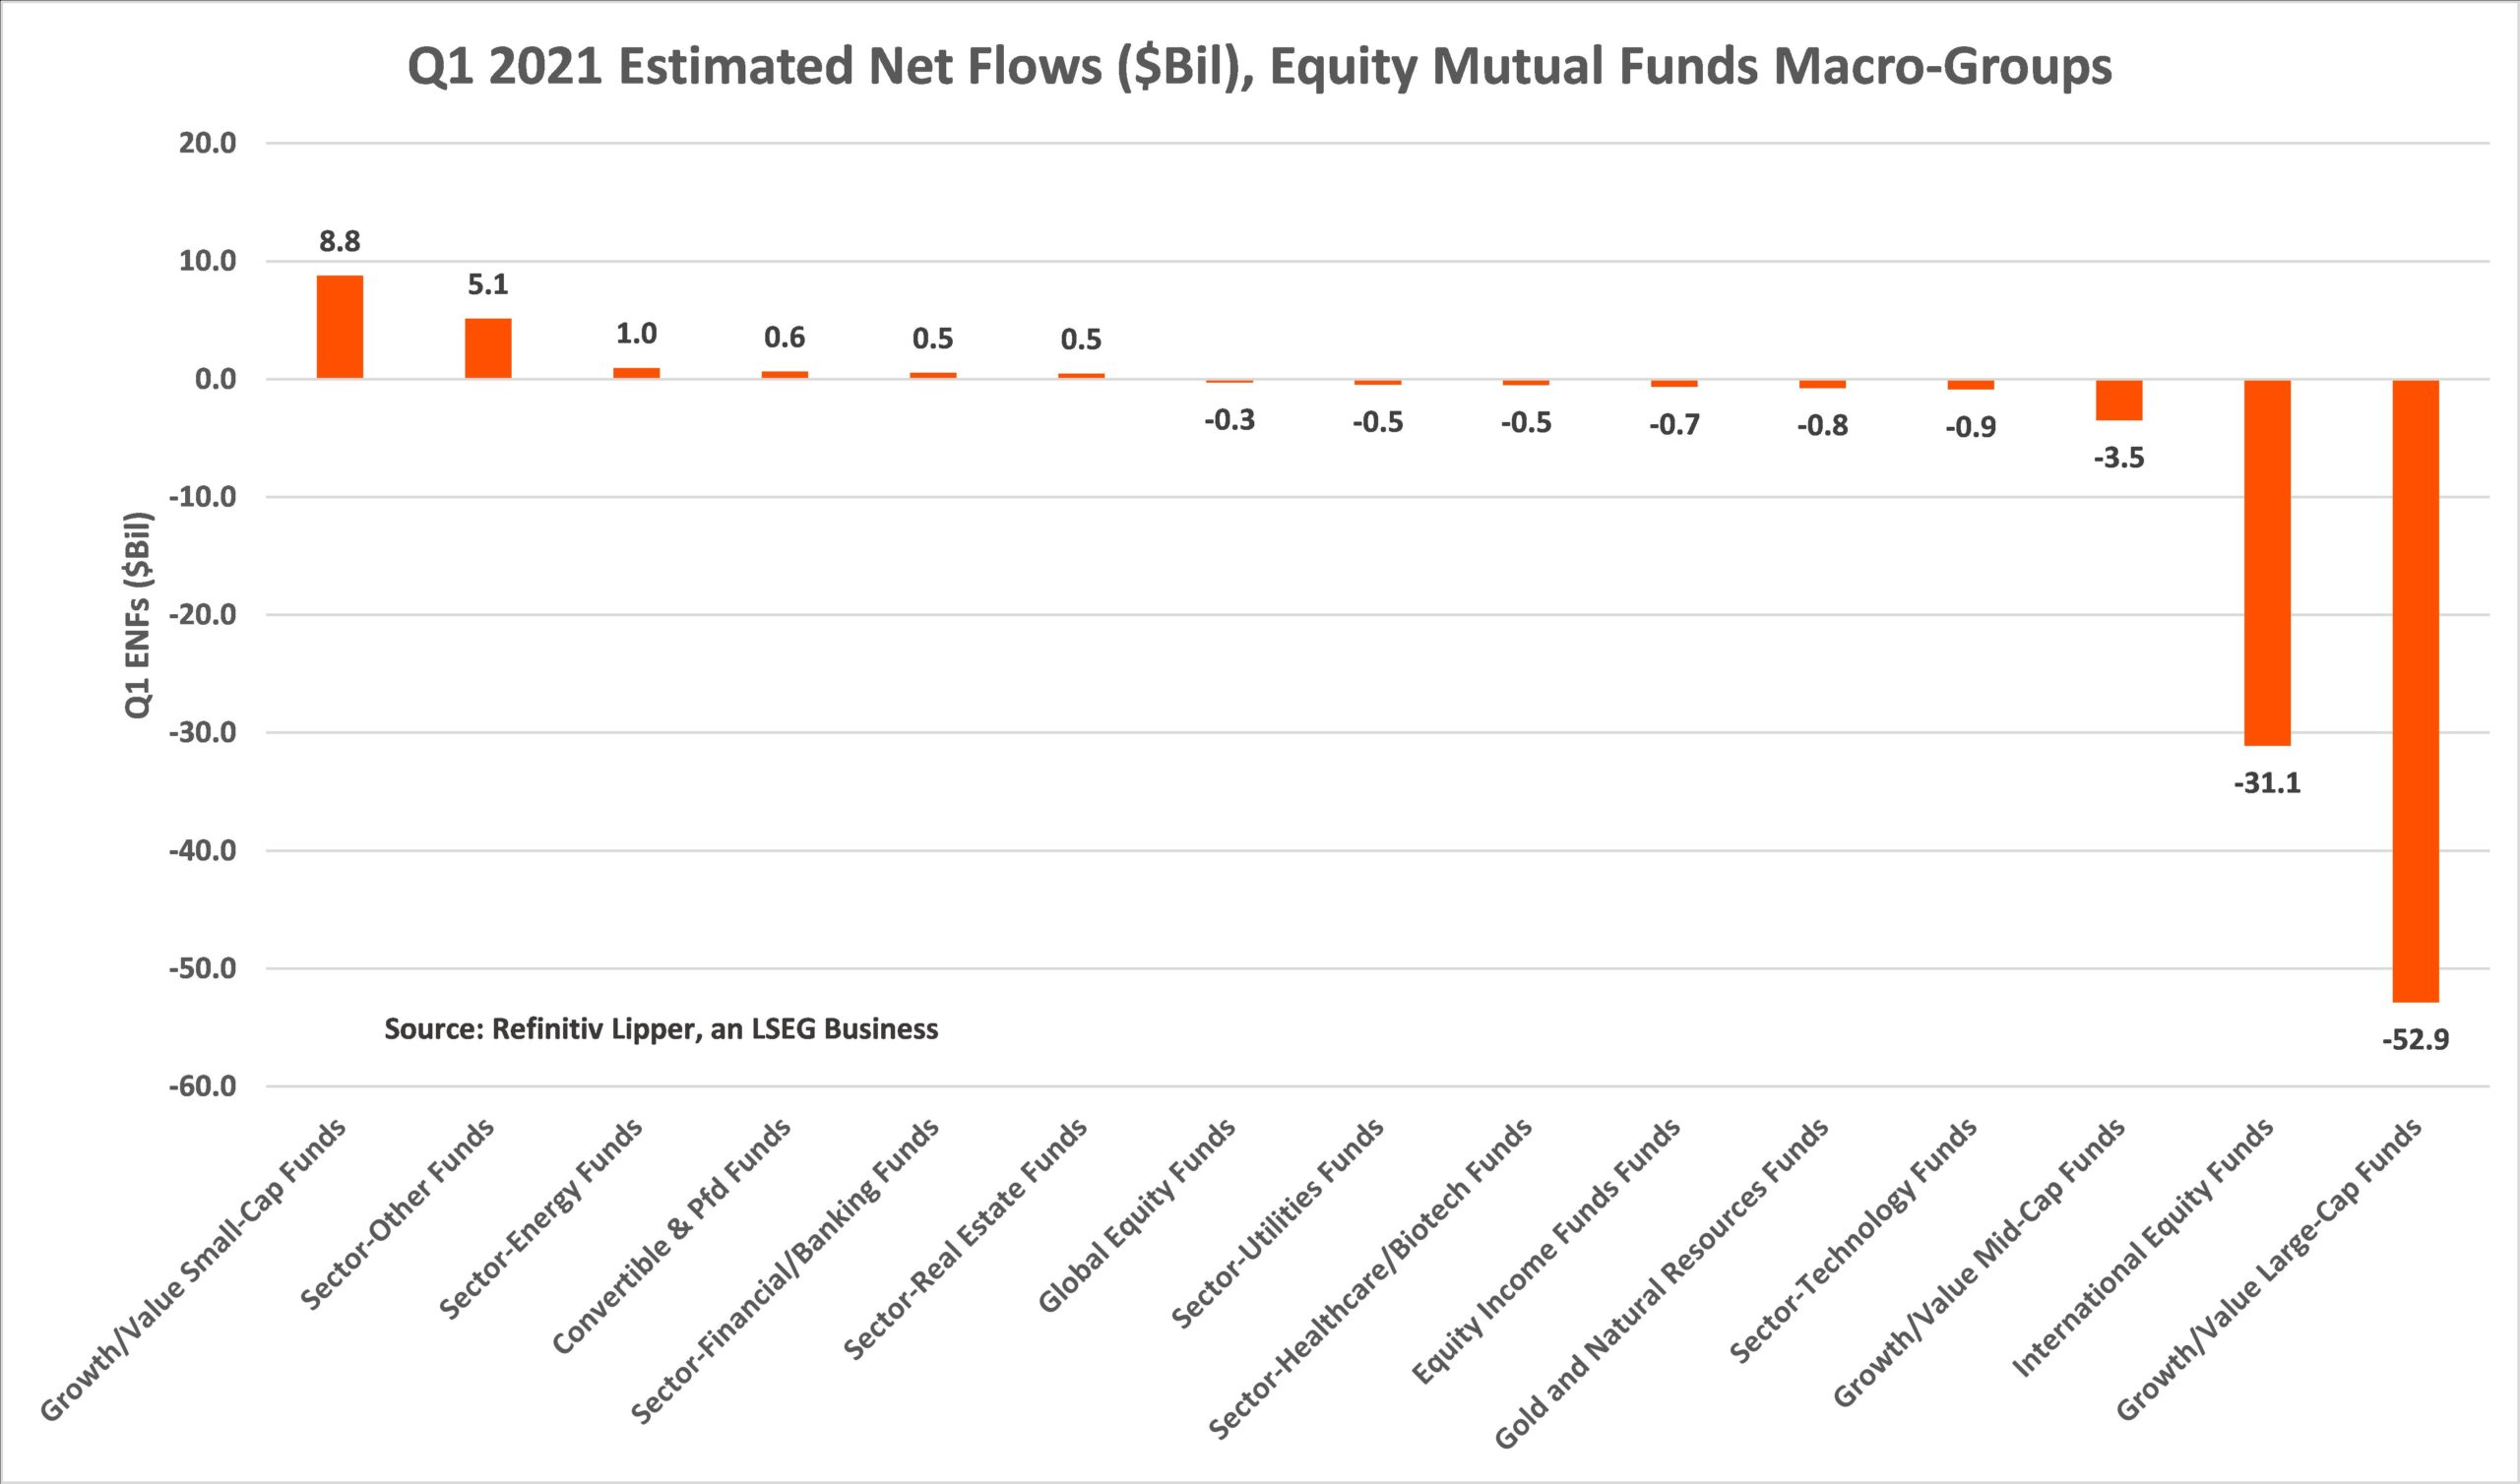
With investors rotating out of the stay-at-home and growth-oriented stocks and into cyclical issues such as financials, energy, and other previously out-of-favor sectors, it wasn’t too surprising that small-cap funds rose to the top of the inflows charts for the quarter, attracting $28.5 billion. The average Lipper Small-Cap Value Fund (+22.12%) posted the second strongest return of all equity classifications for Q1 (outpaced only by Natural Resources Funds, +25.25%).
Sector-financial/banking funds (including ETFs) took the runner-up position, taking in $16.1 billion during Q1, followed by the commodities laden sector-other funds macro-group (+$15.3 billion), sector-technology funds macro-group (+$14.4 billion), and sector-energy funds (+$14.2 billion).
At the bottom of the flows chart were large-cap funds (-$2.5 billion), mid-cap funds (-$673 million), and gold and natural resources funds (-$420 million). Near-month gold futures declined 9.47% for the quarter, while oil futures rose 21.93%.
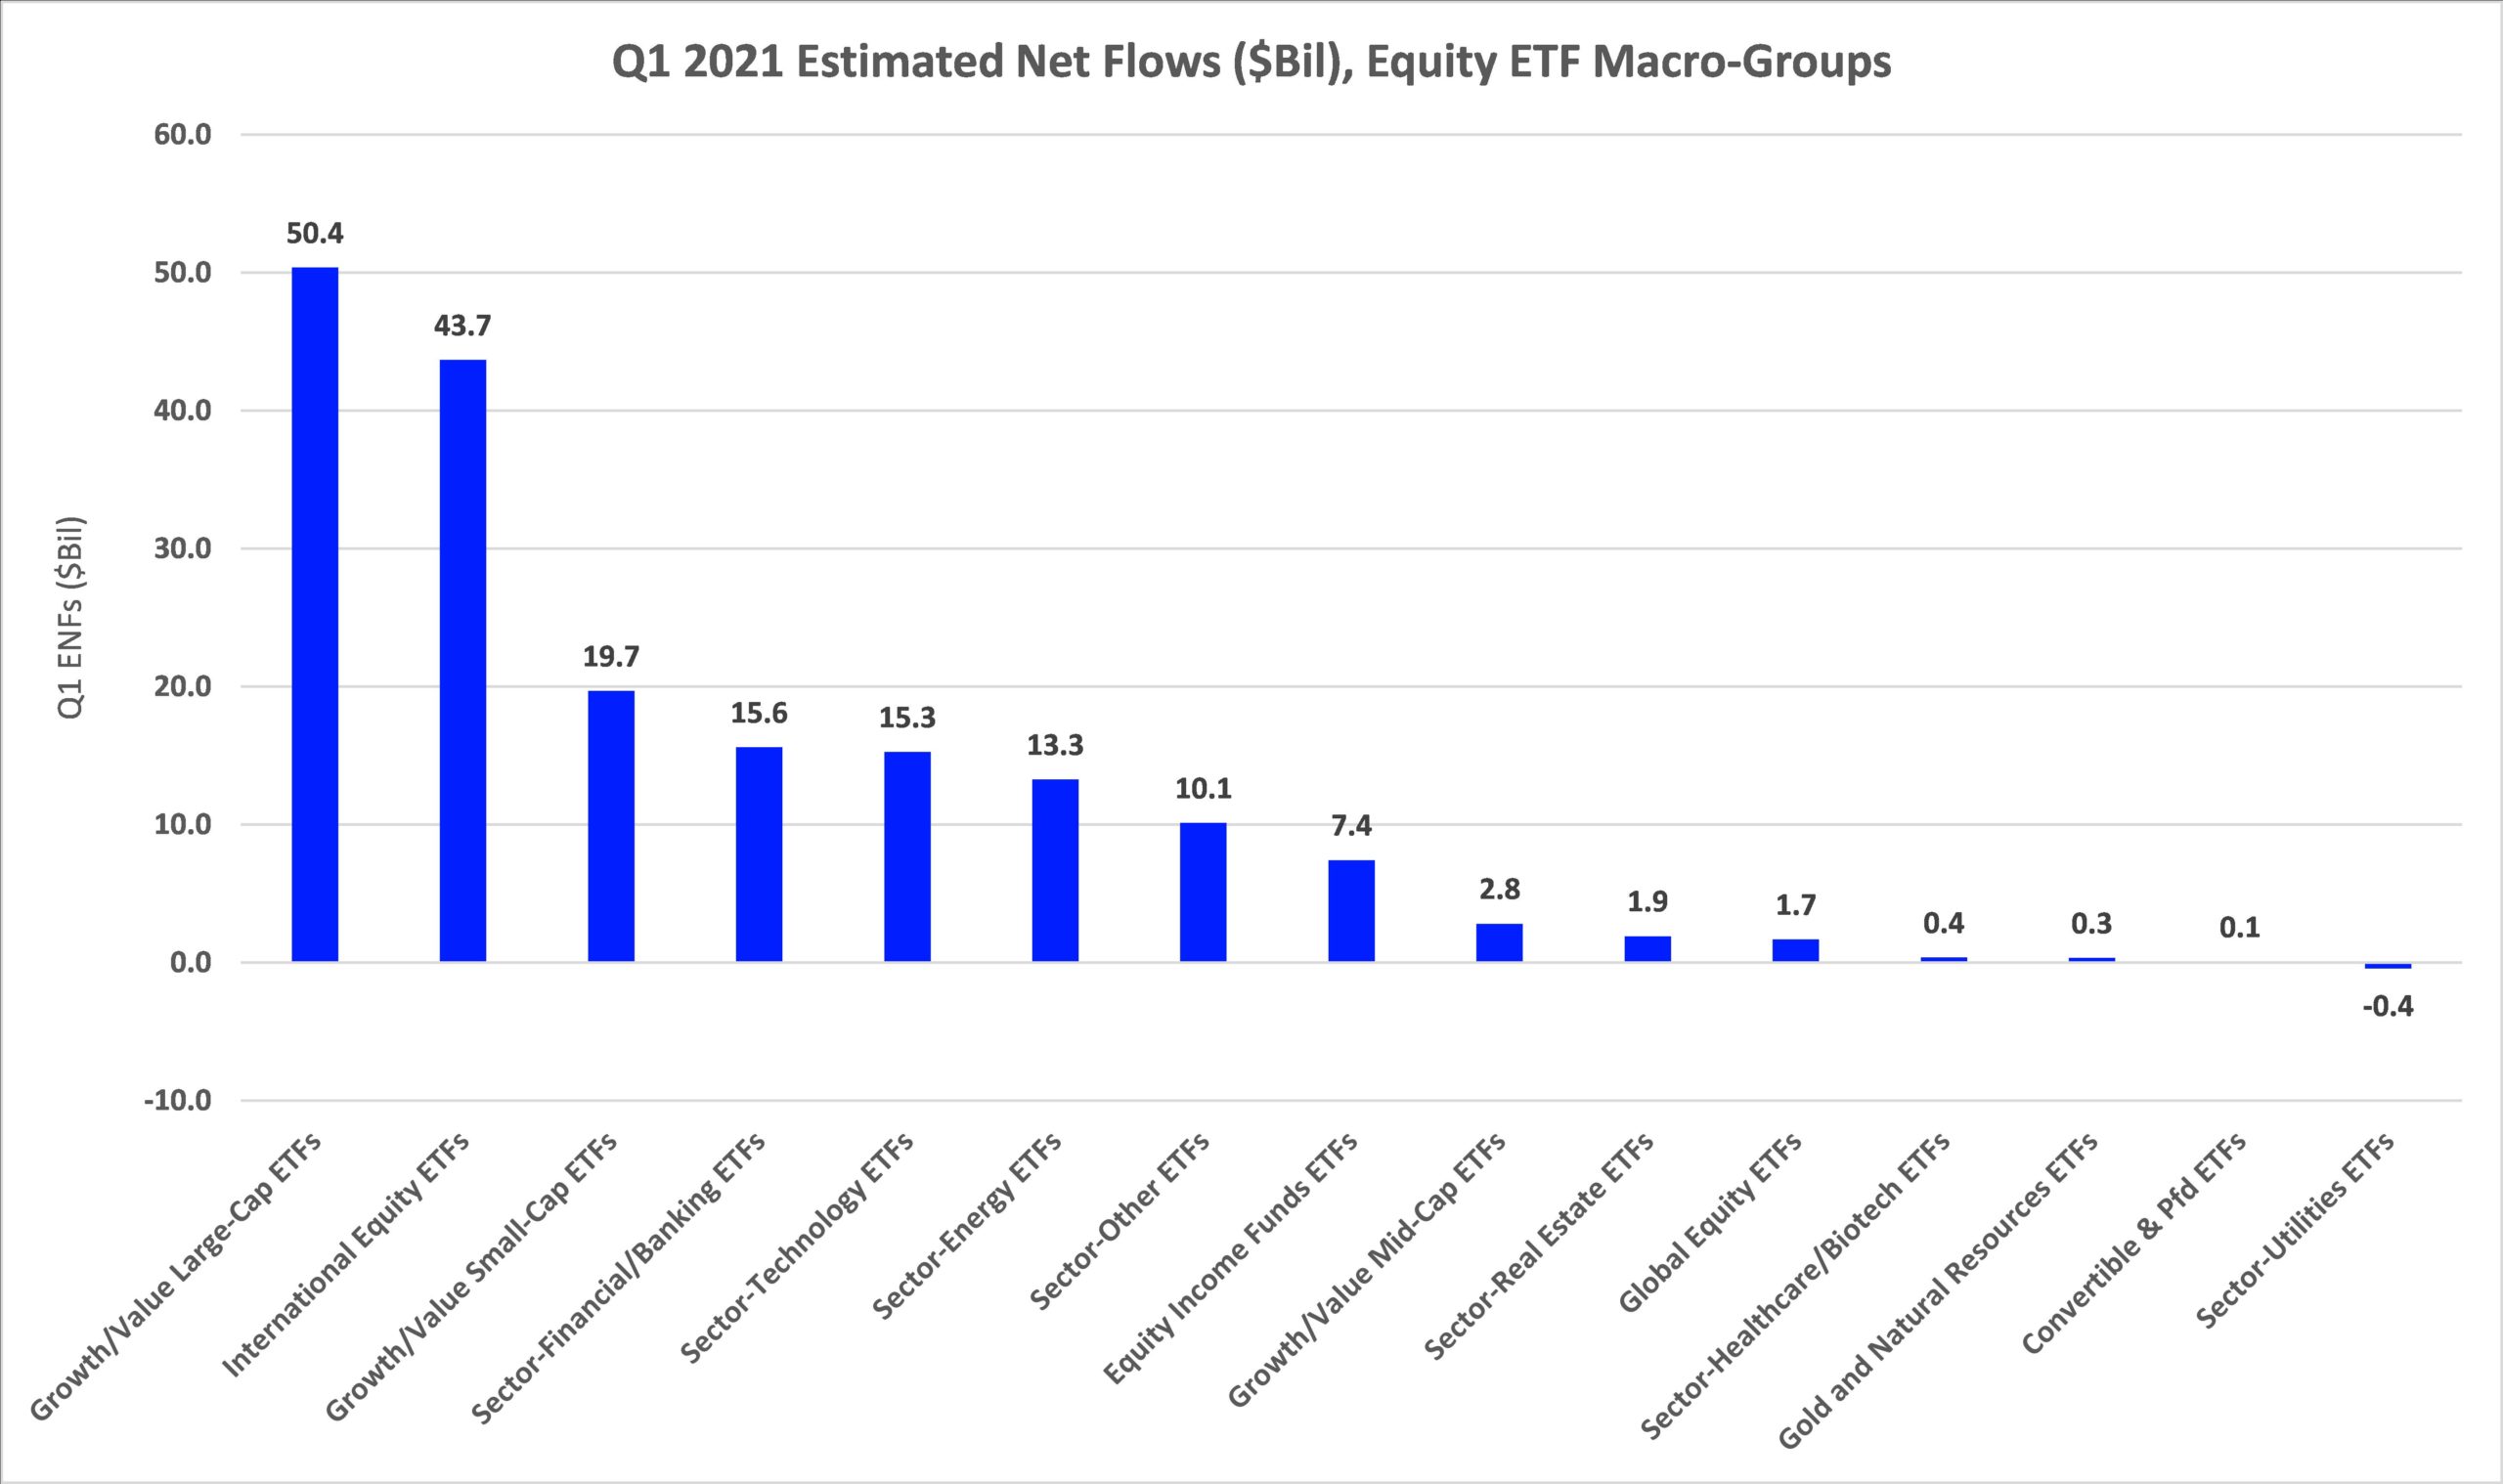
The dichotomy between conventional mutual fund and ETF flows continued during the quarter, with conventional mutual funds taking in just $46.6 billion in long-term assets, while ETFs attracted some $221.6 billion. Fund investors withdrew $74.6 billion from conventional equity funds for the quarter, while ETF investors were net purchasers of equity ETFs, injecting $182.2 billion.
And while both groups continued to be net purchasers of taxable and tax-exempt bond funds, ETF investors appeared to be a bit less sanguine in the fixed income space, injecting $34.4 billion and $4.9 billion into the respective macro-groups. Fund investors on the other hand were net purchasers of taxable bond funds (+$99.4 billion) and municipal bond funds (+$21.9 billion). Corporate investment-grade debt funds and ETFs were the main draw of net new money on the taxable bond side for both investor types, taking in $90.6 billion and $22.7 billion, respectively.
Focusing on flows into individual ETFs on the equity side, Vanguard S&P 500 ETF (NYSE:VOO, +$16.9 billion) took in the largest amount of net new money for the quarter, followed by Vanguard Total Stock Market Index Fund ETF Shares (NYSE:VTI, +$9.4 billion) and Financial Select Sector SPDR® Fund (NYSE:XLF, +$8.6 billion).
SPDR® Gold Shares (NYSE:GLD), -$7.5 billion) suffered the largest net redemptions of equity ETFs for Q1, bettered by iShares MSCI USA Min Vol Factor ETF (NYSE:USMV, -$5.5 billion) and SPDR® S&P 500 (NYSE:SPY, -$2.9 billion).
On the ETF fixed income side, iShares Core Total USD Bond Market ETF (NASDAQ:IUSB, +$6.4 billion) rose to the top of the flows leaderboard, followed by Vanguard Total Bond Market Index Fund ETF Shares (NASDAQ:BND, +$5.6 billion), Vanguard Total International Bond Index Fund ETF Shares (NASDAQ:BNDX, +$3.4 billion), and Schwab U.S. TIPS ETF™ (NYSE:SCHP, +$2.7 billion).
At the bottom of the flows barrel, iShares iBoxx $ Investment Grade Corporate Bond ETF (NYSE:LQD, -$10.5 billion) and iShares iBoxx $ High Yield Corporate Bond ETF (NYSE:HYG, -$4.6 billion) suffered the largest net redemptions.


