Is 15 months in a row of rising core inflation ‘contained?’
Year-on-year core CPI has now risen for 15 consecutive months. At some point, it will seem reasonable to let it have a month off, but until now it hasn’t needed it. Fifteen months in a row. That’s impressive. It’s so impressive, in fact, that it hasn’t happened since 1973-1974, when prices were catching up from the failed experiment of price controls imposed by President Nixon in 1971-73. Core inflation has never, in the history of the data (which exists since 1957), accelerated for 16 consecutive months. So, next month we have a chance for a record!
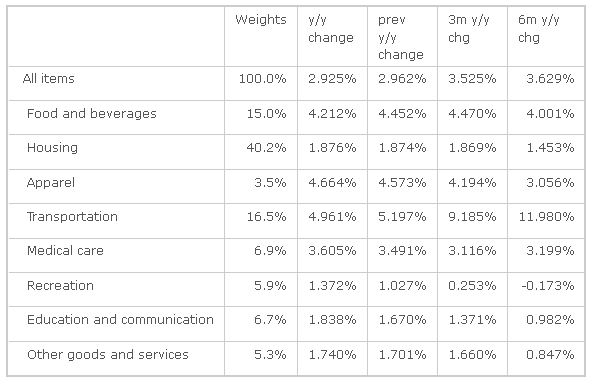
Headline inflation was softer-than-expected by 0.1%, even as the NSA CPI index itself came in higher than-expected. As I pointed out yesterday, that was a semi-predictable consequence of the change to new seasonal adjustment factors. Core inflation was 0.218% month-on-month, however, which actually generated a rise in the rounded year-on-year index to 2.3% (2.277% to three decimal places). The table below shows the evolution of the year-on-year changes for the eight major subgroups from 6 months ago to 3 months ago to last month, to now.
Compared to last month, Apparel, Medical Care, Recreation, and Education/Communication accelerated, groups which total 23% of the consumption basket. Transportation and Food & Beverages both decelerated, and they total 31.5% of the basket. Now, notice that Transportation and Food & Beverages are the two groups that are most affected by direct commodity costs – energy and food, respectively. So…don’t get too excited by the deceleration there, although new and used motor vehicles and other components of Transportation also decelerated and that doesn’t have much to do with energy prices. In Food & Beverages, “Food at home” is decelerating (about 57% of the Food & beverages category) while “Food away from home” and “Alcoholic beverages” (the balance of the category) are accelerating.
Yes, you can get eyestrain looking too closely at these figures, but doing so does help.
For example, one theme I think the Fed is counting on is that the “Housing” component of CPI is expected to decelerate due to the still-high inventory of unsold homes and the fact that foreclosure sales can now proceed. It has been a conundrum why rents have been rising while home prices stagnate (actually, not much of a conundrum: there is an underlying inflation dynamic that in the case of the housing-asset market is being overwhelmed by a decline in multiples. But this is a conundrum to the Fed, and to be fair I also expected Housing inflation to be lower than it has been recently). And in this month’s data, you can see that the year-on-year increase in Housing CPI flattened out. But, as the table below shows, the Shelter component wasn’t what flattened out. Housing only went sideways because the “Fuels and Utilities” component declined – again, a commodity effect.
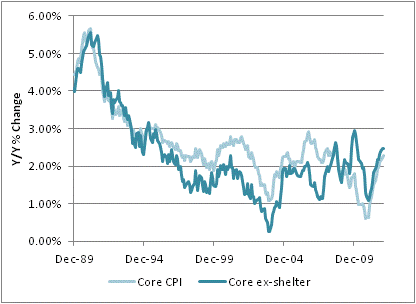
I still expect Housing inflation to level out and probably to decline, but so far those expectations have been dashed. It will be uncomfortable for the Fed if it remains this way; a significant part of their expectations for a visually-contained core inflation number is (mathematically) due to the expectation that housing inflation isn’t going to keep rising. As you can see in the chart below (Source: Enduring Investments http://www.enduringinvestments.com), the rest of core inflation outside of Shelter is continuing to rise. Inflation is not ‘contained’, except maybe for housing. Maybe.
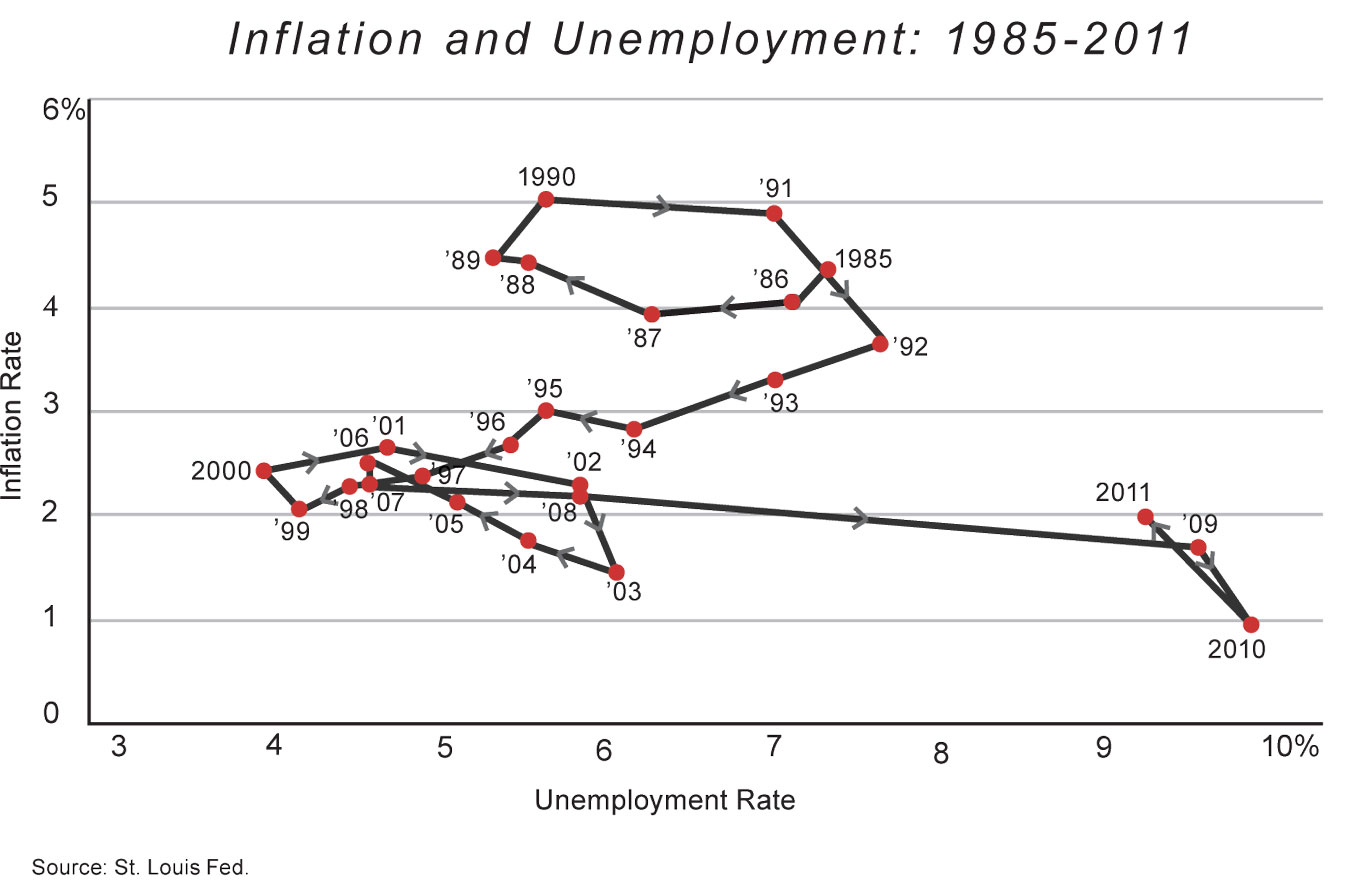
I am fairly confident, though, that if Housing inflation does not decelerate as expected, then the Fed will find some other reason to ignore the very clear acceleration in inflation. The economists at the FRB are for the most part true believers in the notion that the output gap constrains any possible acceleration in inflation, despite ample evidence that output gaps don’t matter (or, anyway, matter far less than monetary variables). For another view of this proposition, see the Chart below, taken from this article by economist John Cochrane.
Fed economists also feel strongly that “well-anchored inflation expectations” means that they can ignore 15-month trends in core inflation, despite the fact that by Chairman Bernanke’s own admission we aren’t really very good at measuring inflation expectations (to be kind).
They have time. The Fed has recently begun to treat 2% (on core PCE, not core CPI) as more of a floor than a target, so it will be some months, even if core inflation doesn’t pause for a month or two pretty soon, before the Committee starts getting at all warm under the collar about inflation. Even then, they are extremely unlikely to take steps to reduce liquidity while Unemployment remains high. The Fed is in a political bind, and the only easy path for them is to “see no evil” on inflation while hoping that Unemployment drops swiftly enough for them to act before prices really get out of hand. We will see.
- English (UK)
- English (India)
- English (Canada)
- English (Australia)
- English (South Africa)
- English (Philippines)
- English (Nigeria)
- Deutsch
- Español (España)
- Español (México)
- Français
- Italiano
- Nederlands
- Português (Portugal)
- Polski
- Português (Brasil)
- Русский
- Türkçe
- العربية
- Ελληνικά
- Svenska
- Suomi
- עברית
- 日本語
- 한국어
- 简体中文
- 繁體中文
- Bahasa Indonesia
- Bahasa Melayu
- ไทย
- Tiếng Việt
- हिंदी
Inflation: As ‘Contained’ as an Arrow From a Bow
Published 02/19/2012, 12:26 AM
Updated 02/22/2024, 09:00 AM
Inflation: As ‘Contained’ as an Arrow From a Bow
Latest comments
Loading next article…
Install Our App
Risk Disclosure: Trading in financial instruments and/or cryptocurrencies involves high risks including the risk of losing some, or all, of your investment amount, and may not be suitable for all investors. Prices of cryptocurrencies are extremely volatile and may be affected by external factors such as financial, regulatory or political events. Trading on margin increases the financial risks.
Before deciding to trade in financial instrument or cryptocurrencies you should be fully informed of the risks and costs associated with trading the financial markets, carefully consider your investment objectives, level of experience, and risk appetite, and seek professional advice where needed.
Fusion Media would like to remind you that the data contained in this website is not necessarily real-time nor accurate. The data and prices on the website are not necessarily provided by any market or exchange, but may be provided by market makers, and so prices may not be accurate and may differ from the actual price at any given market, meaning prices are indicative and not appropriate for trading purposes. Fusion Media and any provider of the data contained in this website will not accept liability for any loss or damage as a result of your trading, or your reliance on the information contained within this website.
It is prohibited to use, store, reproduce, display, modify, transmit or distribute the data contained in this website without the explicit prior written permission of Fusion Media and/or the data provider. All intellectual property rights are reserved by the providers and/or the exchange providing the data contained in this website.
Fusion Media may be compensated by the advertisers that appear on the website, based on your interaction with the advertisements or advertisers.
© 2007-2024 - Fusion Media Limited. All Rights Reserved.
