This article was written exclusively for Investing.com
- Inflation can be a tough beast to tame
- Cotton explodes to a multi-year high; Memories of a decade past
- Lumber snaps back to near its all-time high
- The bond market is also sending an inflationary signal
- Watch those raw material prices for clues
In August 2020, the US Federal Reserve made a not so subtle change in its expectations for inflation. For years, the central bank set a 2% target for the economic condition. The shift changed the target to an average. The Fed moved from its hard line in the sand to encourage higher inflationary pressures. Since inflation has been running well below its target over the past years, the voting FOMC members signaled that they would tolerate a prolonged inflationary period north of the previous 2% target.
Meanwhile, measuring inflation is an art and far from a science. The Fed’s formula for inflation is subjective, at best. Since asset prices fell to lows in March and April 2020 as the global pandemic caused a risk-off period, commodity prices have been rising.
Cotton and lumber are raw materials that trade in the futures market. Cotton fell to a low of 48.35 cents per pound on the nearby ICE futures contract in late March and early April. The fluffy fiber’s price hit the lowest level in more than a decade, since 2009. Lumber, a critical construction material, fell to a low of $251.50 in April. In a little less than one year, the price of cotton has almost doubled, and lumber nearly quadrupled—a sign that inflationary pressures are rising.
Inflation can be a tough beast to tame
The US central bank is making a calculated bet that inflationary pressures will edge up rather than explode higher, which could turn out to be more than a leap of faith. Throughout history, there are many examples of inflation running rampant. Perhaps the most significant was Germany, in the aftermath of World War I, which destroyed the value of the German mark versus the US dollar. In early 1922, 160 marks were equivalent to one US dollar. By November 1923, it took 4.2 trillion marks to purchase one US dollar. Today, Venezuela has the world's highest inflation rate, at around ten million percent.
When inflation begins to accelerate, the risk is hyperinflation, which is rapid, excessive, and out-of-control general price increases in an economy. The condition is typically above 50% per month.
Hyperinflation can have a devastating impact on economic and political conditions. Increasing the money supply can lead to demand-pull inflation which are the ingredients that create the situation. When aggregate demand outpaces aggregate supply, or too much money chases too few goods, demand-pull inflation is the result.
The US Fed assumes that it can attack rising inflation with short-term interest rates and other monetary policy tools. However, once the inflationary ball begins rolling down the hill, it can pick up steam, making rising prices challenging to control or stop. There is always a chance that the central bank could find itself chasing inflationary pressures with interest rate hikes, and the process could spiral out of control.
Over the past months, we have seen many commodity prices move higher.
Cotton explodes to a multi-year high; Memories of a decade past
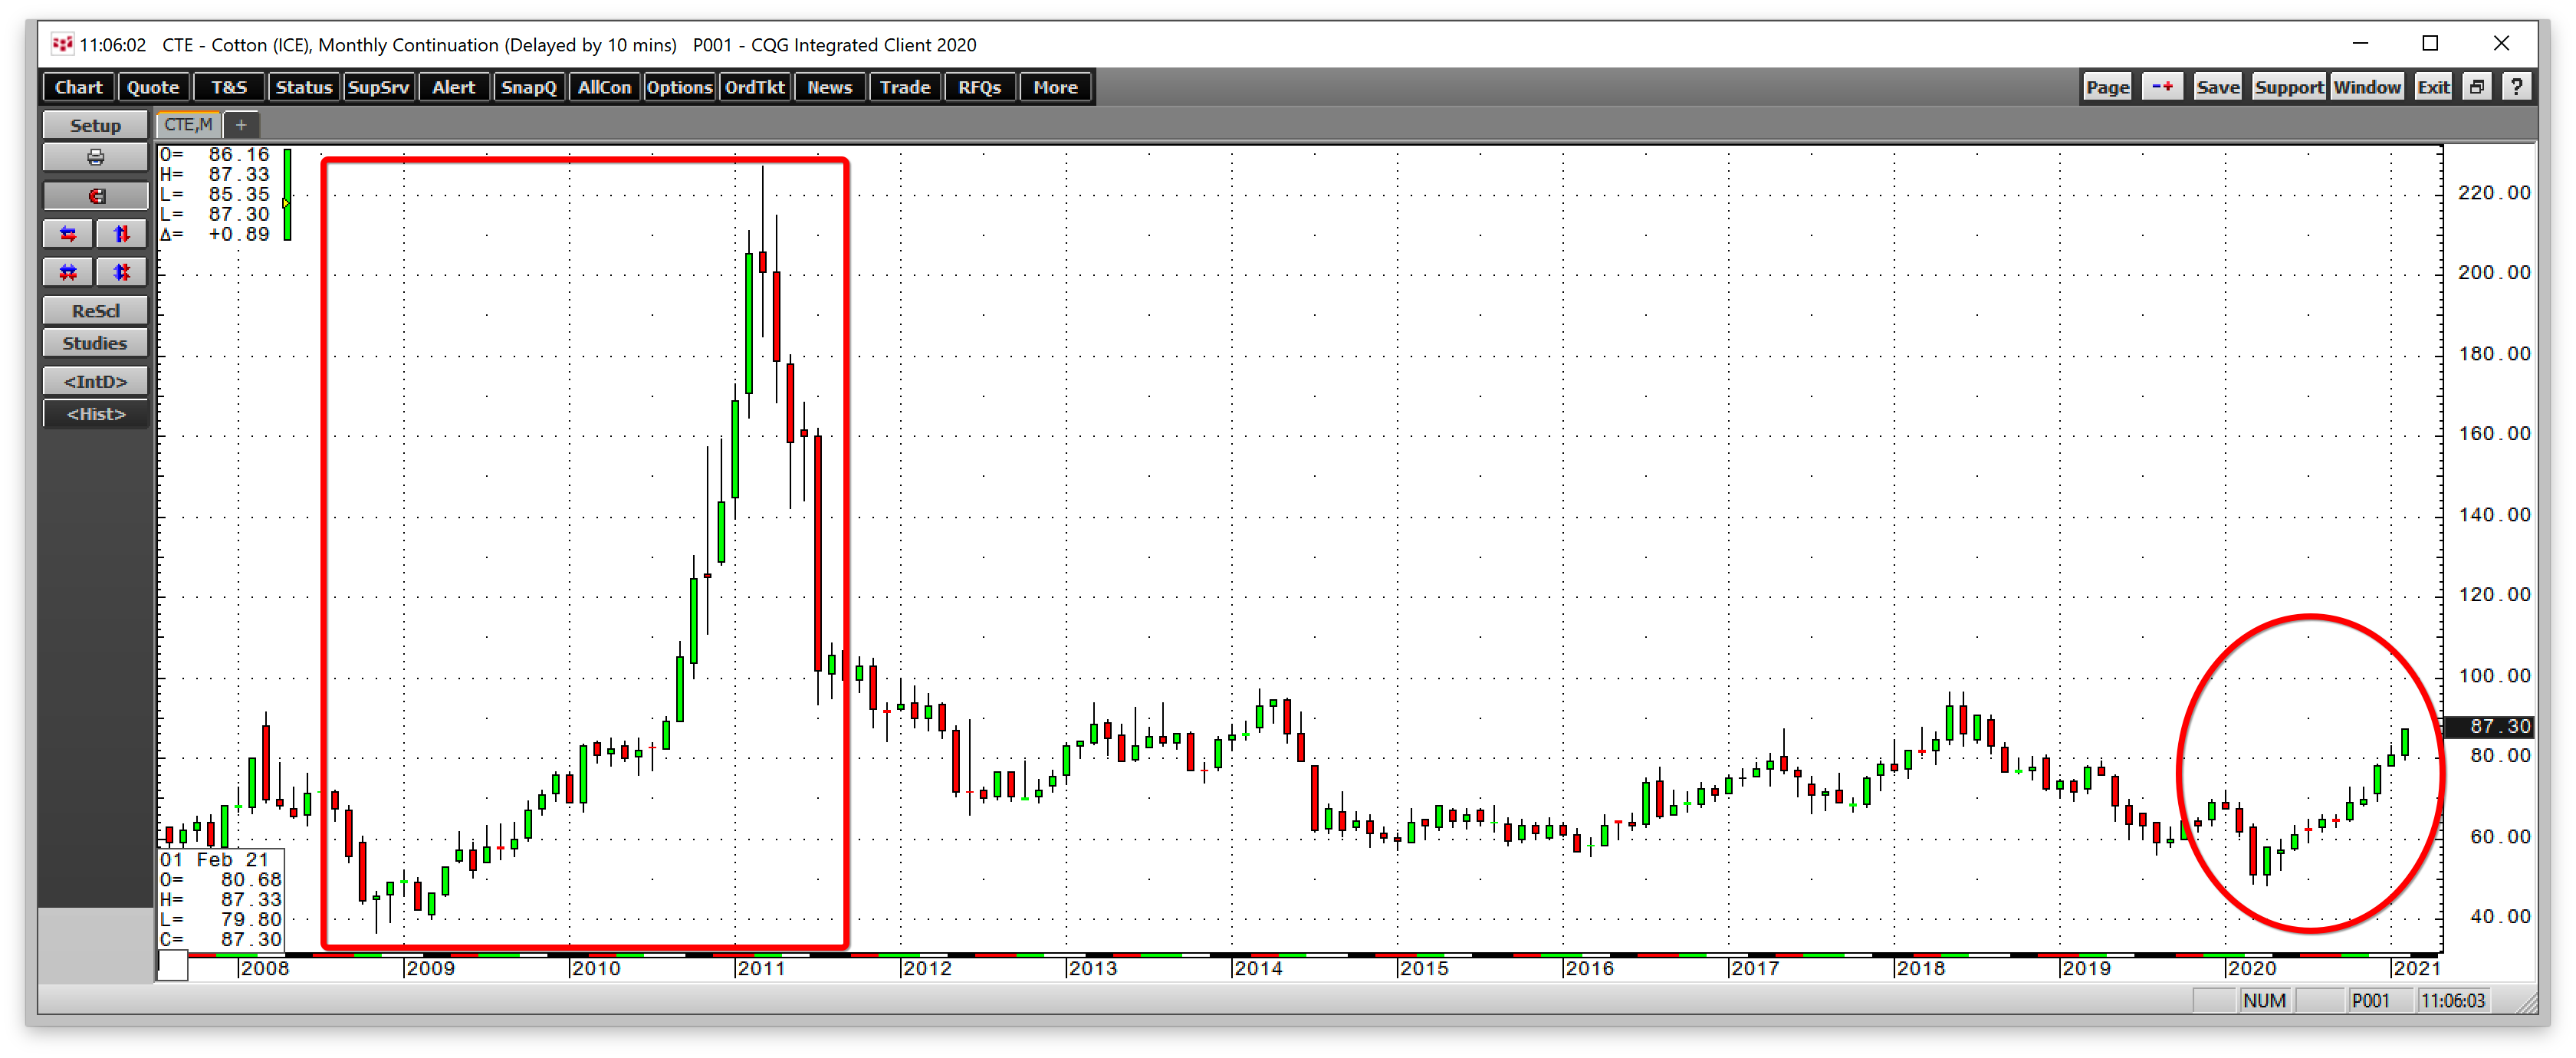
The cotton futures market is far less liquid than many of the other markets that trade on exchanges. However, cotton is an agricultural product that is a critical ingredient in garments, bedding, and many other items. In April 2020, the nearby cotton futures price reached a low of 48.35, the lowest level since April 2009. In early 2021, the price moved above 80 cents per pound. 
Source, all charts: CQG
The monthly chart highlights that cotton’s price rose to a high of 87.33 cents on Feb. 12, over 80% above the price ten months before. Cotton made higher highs and higher lows over the period and was trading at its highest price since August 2018 at the end of last week.
The last time stimulative central bank and government policies lifted the price of cotton came from 2008 through 2011, in the aftermath of the global financial crisis. During that period, cotton rose from 36.7 cents to a record high of $2.27 per pound.
Cotton’s rise could be signaling accelerating inflationary pressures as more and more currency is required to purchase a pound of the fluffy fiber since April 2020.
Lumber snaps back to near its all-time high
Lumber is an even less liquid futures market than cotton.
However, wood is a critical construction material used in new home construction, home repairs, infrastructure building and rebuilding. 
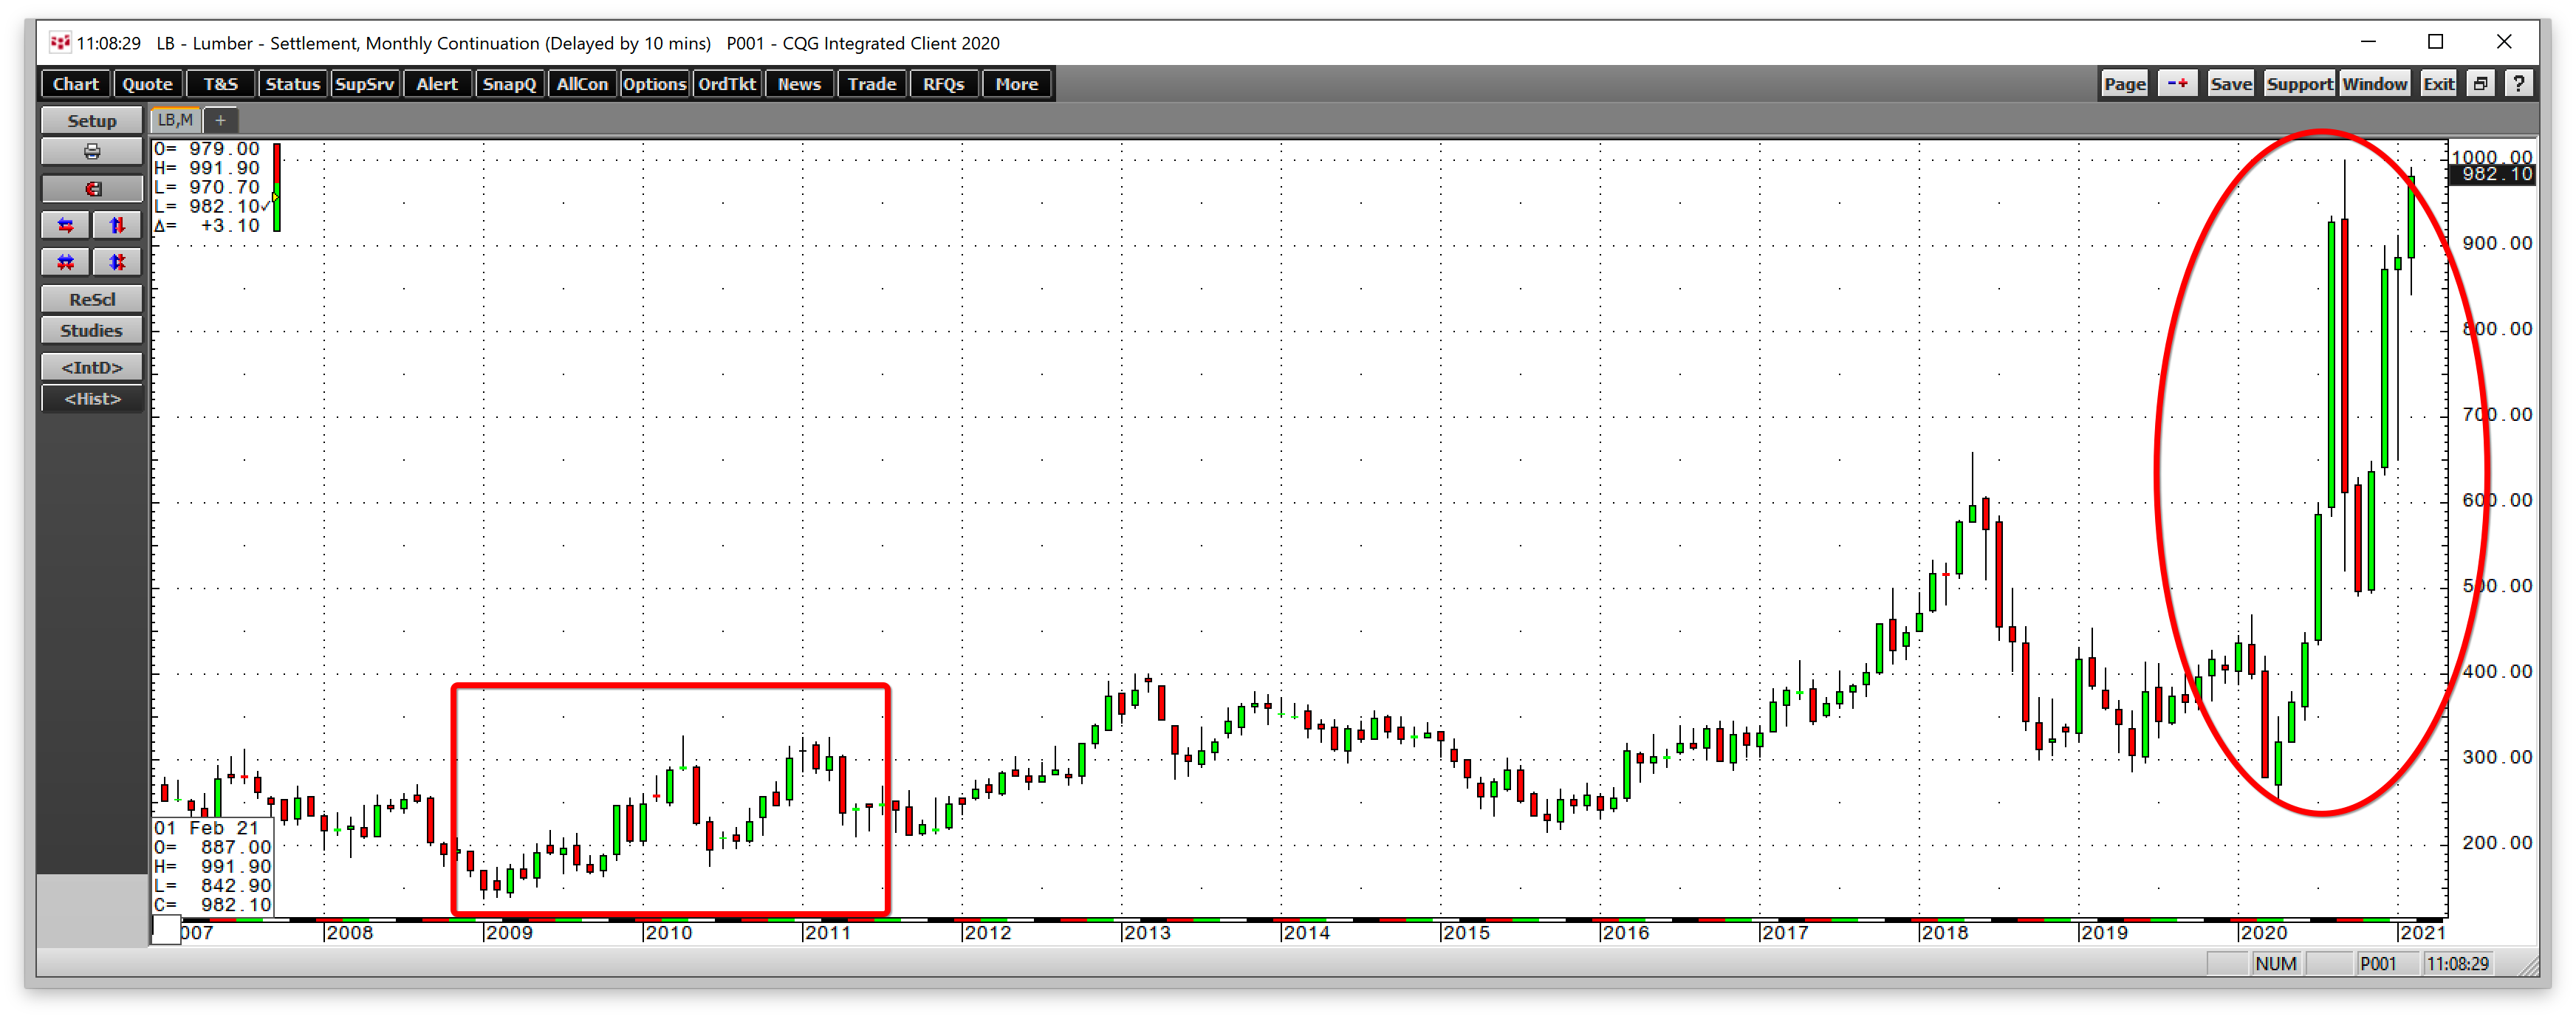
The chart shows that lumber futures rose from $137.90 in early 2009 to a high of $325.20 in 2011 as stimulus and liquidity weighed on the US dollar’s purchasing power. In 2020, the price of wood futures fell to a low of $251.50 per 1,000 board feet in April and exploded to a record high of $1,000 in September 2020. After a dip to $490.80 in October, lumber snapped back higher and was over $980 per 1,000 board feet at the end of last week.
Lumber and cotton are far less liquid markets than crude oil, copper, grains, and the many other raw materials that trade on the futures exchanges. The lack of liquidity can exacerbate price moves on the up and downside. Meanwhile, the substantial rallies are a sign that inflationary pressures are rising. It now takes a lot more dollars to purchase these commodities than ten months ago, and the trends in both markets remain higher.
The bond market is also sending an inflationary signal
Bonds can be the best inflation indicator as they move inversely to interest rates. While the US Fed determines the short-term Fed Funds rate, the market establishes rates further out along the yield curve. Meanwhile, the Fed’s quantitative easing program is an attempt to keep longer-term rates low via purchases of $120 billion of debt securities each month.
However, market forces are still pushing bonds lower and rates higher despite the monetary policy tool the central bank uses to encourage borrowing and spending and inhibit saving.

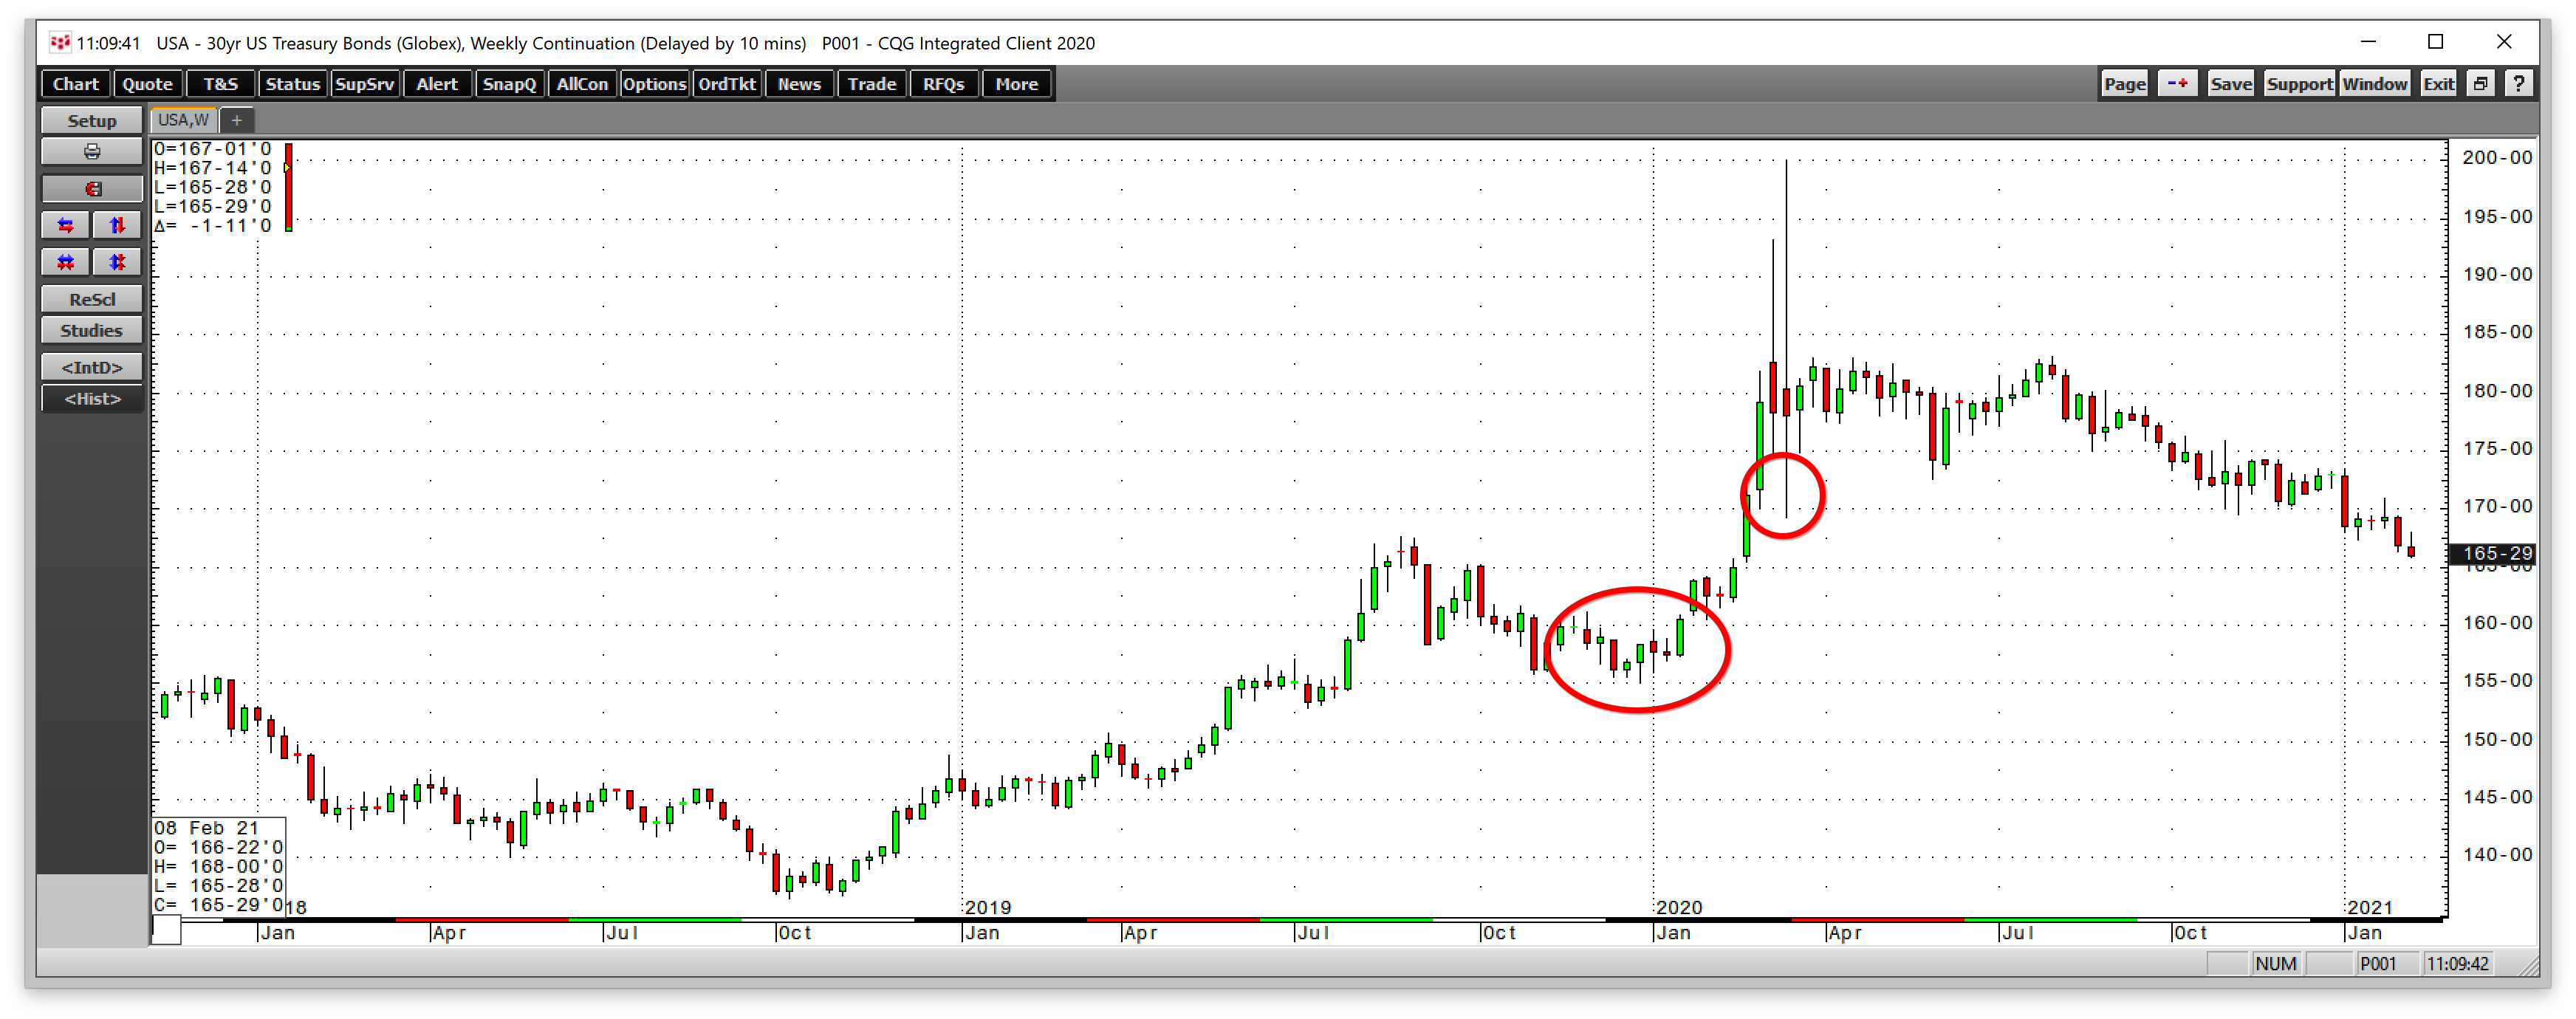
The weekly chart of the US 30-year Treasury bond futures contract shows a bearish trend with rising interest rates since early August 2020. In mid-October 2020, the long bond futures fell below the first level of technical support at the 172-17 June 2020 low. In early 2021, the next level of support at the March 2020 low of 169-09 gave way. The 30-year bond futures traded to a lower low of 165-28 last week and closed near the low. The next level of technical support stands at 155-05, the late 2019 low. Rising rates on the long bond are a sign of increasing inflationary pressures.
Watch those raw material prices for clues
Cotton and lumber prices are not the only commodities that have appreciated since March and April 2020. Copper, a bellwether for the global economy, moved from $2.0595 last March to a high of $3.8050 per pound and was sitting at over $3.7880 at the end of last week. WTI crude oil, the energy commodity that continues to power the world, rose from negative $40.32 per barrel in April 2020 to nearly $59.50 per barrel on Friday and was close to the high on Feb. 12. Brent crude oil, was at $62.43 per barrel at the end of last week. corn and soybean prices fell to lows of $3.0025 and $8.0825 last April and were trading at $5.3875 and nearly $13.72 per bushel on Feb. 12.
Energy, industrial, and agricultural prices have posted substantial gains over the past ten months. The trend in all these sectors remains higher while the bond market has declined below technical support levels. The Fed is encouraging inflationary pressures, but they could get more of the economic condition than they anticipate.
Watch those commodity prices. A continuation of gains will signal that the expanding money supply is getting beyond the central bank’s control.
