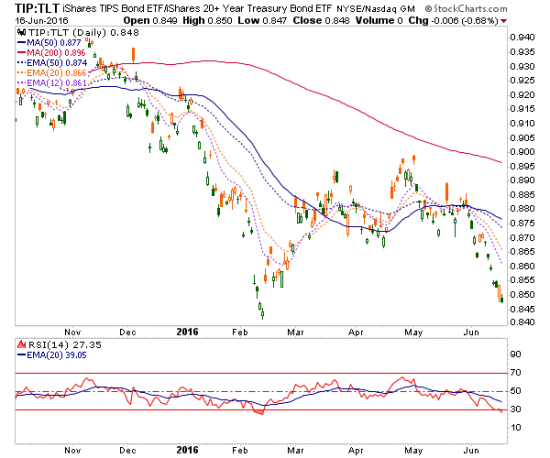
Recently I have gotten wordy about the decline in ‘inflation expectations’ beginning on June 2, right on through yesterday’s update of the TIP-TLT ratio and TLT in essence, attaining their targets. The implication would be that the mini deflation whiff is coming to its limits.
As often happens at potential limit points, the market’s crosscurrents are strong. As noted yesterday, USD, gold, silver and the gold miners all did in-day reversals as items that had been risk ‘off’ got hammered. ‘What, USD and gold in lockstep? What is the meaning of this?!?’ think inflationists. See yesterday’s in-day post Strange Bedfellows.
The meaning is that these items, along with the VIX and US Treasury bonds have been plays for a risk ‘off’ market as it got the jitters over deflation. Gold miners had been, however fleetingly, rising in line with their counter-cyclical fundamentals and this is the mirror image to the reasons why I so often parrot that if you are a gold miner bull, realize that fundamentally at least, the sector is done no favors in an inflationary backdrop (price, for long stretches of time, can be something else all together).
Back on the inflation/deflation theme, here again is an ‘inflation expectations’ gauge, the TIP-TLT ratio illustrating the drop since late May. As you can see, deflation anxiety is palpable (look no further than the FOMC’s statement on Wednesday) and inflationary expectations are getting over sold.
This would be a handy time to remind you once again of the excellent job Mike Ashton did yesterday in wrapping up the elements of the CPI situation…
“Nothing at all soothing, indeed. A day after the FOMC chose to stand pat on interest rates, core inflation pushed back higher and median inflation is about to push above 2.5% for the first time since 2009 (when it was on the way down). Of course, nothing about this inflation picture, and the rotten internals that suggest higher figures are in store, would have changed the Fed’s decision yesterday. As noted previously in this space, the Yellen Fed fundamentally does not believe that inflation is a threat; if it is a threat, they believe a little inflation is okay if allowing inflation to run hot helps the overall economy and the little guy; and if they later decide inflation does need to be addressed, it can be easily reined in.”
…and my thoughts (both quote items per Full Frontal ‘Inflation Trade’ Ahead?)…
“Inflation is actually being nurtured each time the Fed rolls over and plays dead. And this is not even including the Semi Equipment ‘bookings’ revival, improving manufacturing backdrop (per recent ISM and Empire reports, which each include notable increases in ‘prices paid’) or other reasons I don’t think the economy is quite as weak as the last two Payrolls reports indicated.”
In the posts linked above we have covered lots of details about the deflationary backdrop, the price pressures rising in US service sectors and now, most recently, manufacturing. We have also talked about limits, both short and long-term regarding the current deflationary whiff, and a would-be ‘inflation trade’.
So with the TIP-TLT chart of over sold ‘inflation expectations’ in mind, let’s looks at some other elements with simple charts and brief summaries.
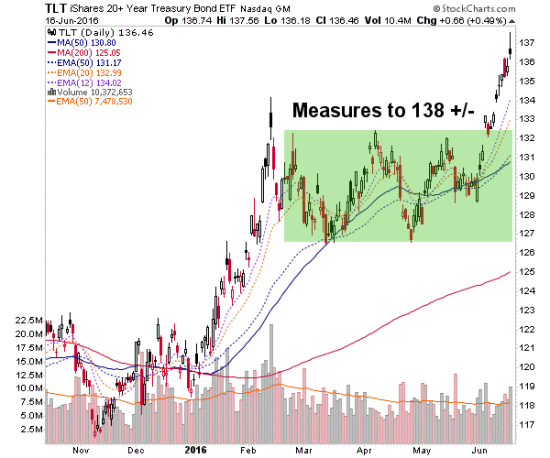
Risk ‘off’ repository TLT got very close to target and is vulnerable.
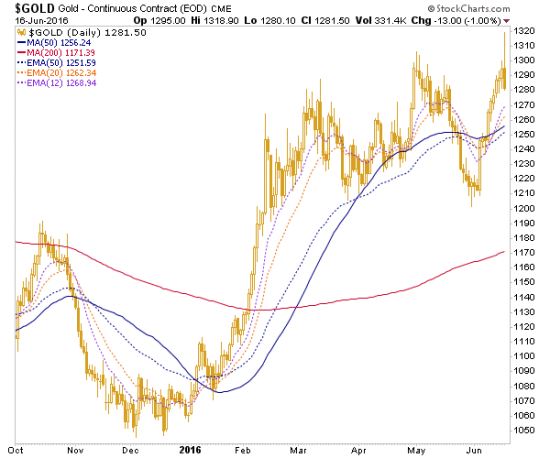
Risk ‘off’ repository Gold made an important new high, reversed downward from it and is vulnerable in the short-term, but made a bullish signal longer-term (see yesterday’s pre-market poston gold and silver).
Silver-Gold ratio dropped but is only testing the breakout. This, in tandem with a rising TIP-TLT would be keys for ‘inflation trade’ ignition.
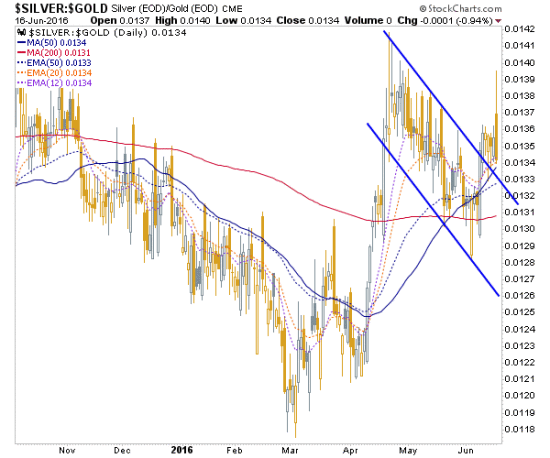
The short-term continues to look constructive at least, for a revival of asset prices from commodities to emerging markets to precious metals (which would be led by silver). But now let’s look at a couple longer-term charts for temperance.
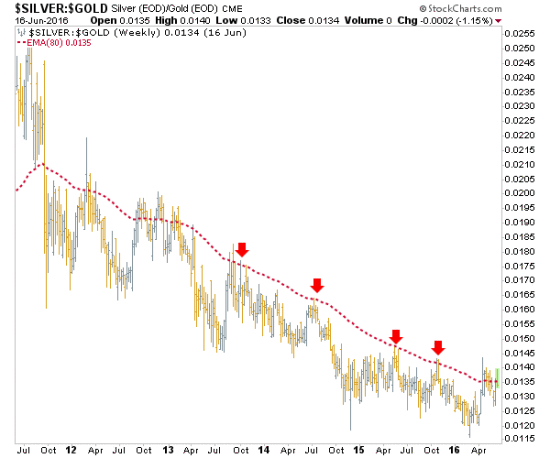
Silver-Gold ratio weekly has not broken the chain that bound commodities and any thoughts of an ‘inflation trade’ all through the global deflationary phase (Goldilocks in the US). But this move has been persistent and should have would-be inflationists on alert.
In the event that gold leads, silver takes over and commodities and certain global markets turn up again, the big daddy of big picture charts will instruct when it would be time to batten down the hatches for a blow-out (barring a Misesian Crack Up Boom) at the Continuum’s limiter AKA the 100 month exponential moving average on the 30-Year Treasury bond yield, where all inflationary bounces, rallies and bull markets have gone to die over these last decades. That’s a long sentence, I know.
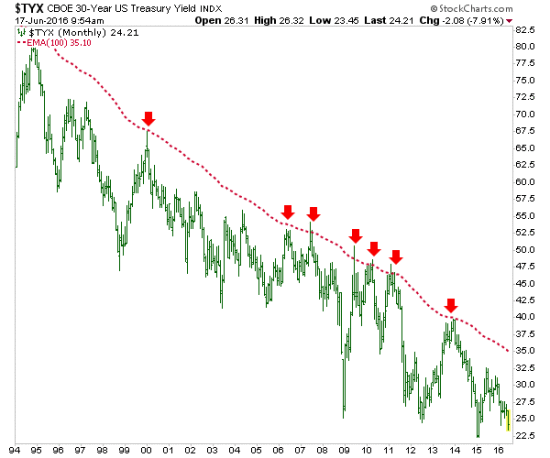
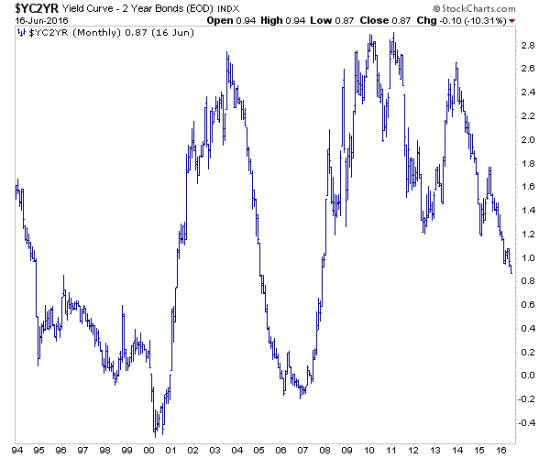
Before closing the post, let’s take a look at another big picture chart. Yield curves would need to bottom out and turn up against an inflationary backdrop. That is not yet indicated, but if it comes about it would be likely to signal inflation as nominal yields rise but long-term yields rise faster than short-term yields. By the way, contrary to popular opinion, rising rates would not hurt gold in this environment. Gold despises a declining yield curve with short-term yields rising faster than long-term yields.
