⭐ Start off 2025 with a powerful boost to your portfolio: January’s freshest AI-picked stocksUnlock stocks

Industrial Sector Continues To Lead U.S. Stock Rally In 2019

Published 03/12/2019, 07:30 AM
Updated 07/09/2023, 06:31 AM
BA
-
SPY
-
XLI
-
XLV
-
XLK
-
XLU
-
XLRE
-

Industrial companies remain the strongest-performing sector for the US stock market year to date, based on a set of exchange-traded funds. Although all the major equity sectors are posting gains so far in 2019, industrials are holding on to a first-place finish as of trading through yesterday’s close (Mar. 11).

Industrial Select Sector SPDR (XLI) is up 16.3% in 2019. The ETF’s performance is modestly ahead of the second-strongest sector advance via Technology Select Sector (XLK), which is ahead by 15.1%.

XLI’s leading return this year is all the more impressive when you consider that the ETF’s top holding is Boeing (NYSE:BA), which has fallen sharply in the wake of news that several countries have suspended operation of the firm’s 737 Max aircraft, which suffered a second fatal crash in less than five months on Sunday.

The weakest sector performer this year is health care. Health Care Select Sector SPDR (XLV) is up a comparatively modest 4.5% year to date.

The stock market overall continues to post a strong year-to-date return, based on an ETF proxy. SPDR S&P 500 (SPY) is up 11.4% through Monday’s close.
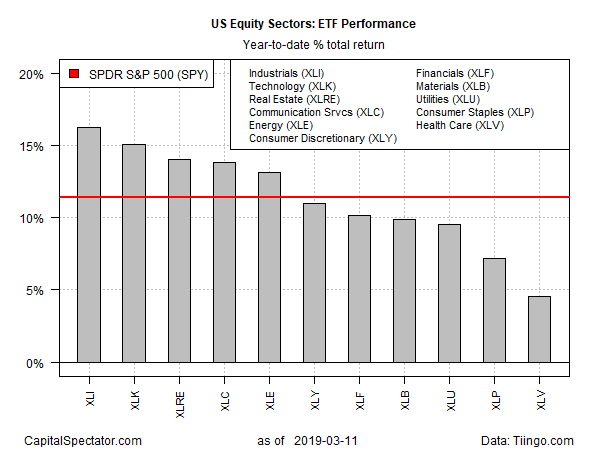
US Equity Sectors ETF Performance

Reviewing sector ETF performance through a technical lens as a proxy for momentum reveals that only four funds are currently posting relatively strong upside biases, based on comparing a set of moving averages. By that score, real estate (XLRE) and utilities (XLU) are red hot, based on 50-day averages well above 200-day averages. Note, too, that both funds closed at new highs yesterday.
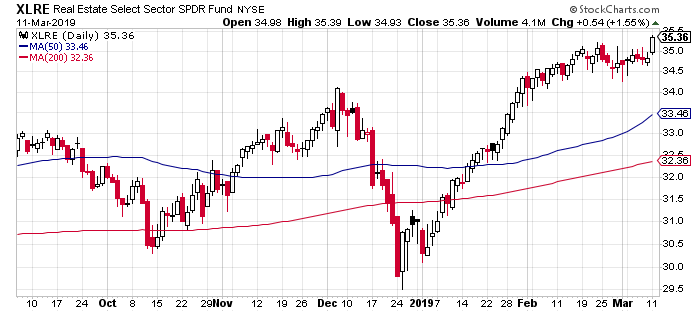
XLRE Daily Chart

The 50-day averages for health care (XLV) and consumer staples (XLP) also closed above their 200-day averages on Monday, but just barely, suggesting that positive momentum is relatively fragile for these ETFs at the moment vs. XLRE and XLU.
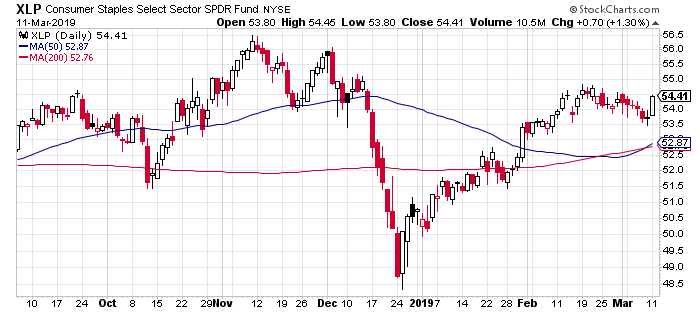
XLP Daily Chart

Latest comments

Loading next article…
Risk Disclosure: Trading in financial instruments and/or cryptocurrencies involves high risks including the risk of losing some, or all, of your investment amount, and may not be suitable for all investors. Prices of cryptocurrencies are extremely volatile and may be affected by external factors such as financial, regulatory or political events. Trading on margin increases the financial risks.
Before deciding to trade in financial instrument or cryptocurrencies you should be fully informed of the risks and costs associated with trading the financial markets, carefully consider your investment objectives, level of experience, and risk appetite, and seek professional advice where needed.
Fusion Media would like to remind you that the data contained in this website is not necessarily real-time nor accurate. The data and prices on the website are not necessarily provided by any market or exchange, but may be provided by market makers, and so prices may not be accurate and may differ from the actual price at any given market, meaning prices are indicative and not appropriate for trading purposes. Fusion Media and any provider of the data contained in this website will not accept liability for any loss or damage as a result of your trading, or your reliance on the information contained within this website.
It is prohibited to use, store, reproduce, display, modify, transmit or distribute the data contained in this website without the explicit prior written permission of Fusion Media and/or the data provider. All intellectual property rights are reserved by the providers and/or the exchange providing the data contained in this website.
Fusion Media may be compensated by the advertisers that appear on the website, based on your interaction with the advertisements or advertisers.
© 2007-2025 - Fusion Media Limited. All Rights Reserved.