Black Friday is Now! Don’t miss out on up to 60% OFF InvestingProCLAIM SALE

Industrial Commodities Update

Published 03/21/2014, 06:49 AM
Updated 07/09/2023, 06:31 AM
US500
-
HG
-
LCO
-
CL
-
COMIN
-

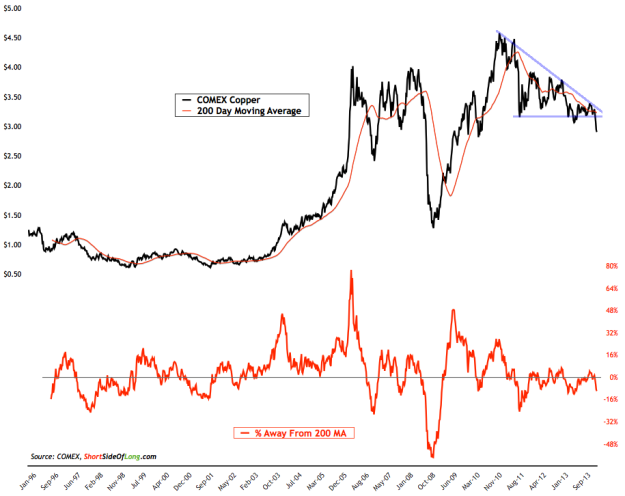
Chart 1: After a 3 year downtrend, Copper is moving into a panic sell off

Copper-vs-200-MA

In early February I focused on the commodity index breaking out. At the time I wrote that:

…Agricultural sector of the commodity index is finally starting to bottom out. And since agriculture makes over 40% of the CRB Index, it was one of the main reasons behind this weeks breakout.

Those exposed to Agricultural commodities have benefited over the last quarter, with Sugar and in particular Coffee outperforming S&P 500 by a large margin. However I also stated that Agricultural rally on its own is not enough to confirm a commodities bull market.

…it is important to get confirmation from the economically sensitive commodities before one should take a bullish stance. For example… Copper and Brent Crude are yet to break out of their respective downtrends.

Copper is one of the most important metals in the building sector and a great barometer of the overall Industrial Metals space, which has also not broken out yet. Moreover, Brent Crude Oil is a better gauge of global Oil prices relative to West Texas Intermediate Crude and a great indicator of the global economic activity.

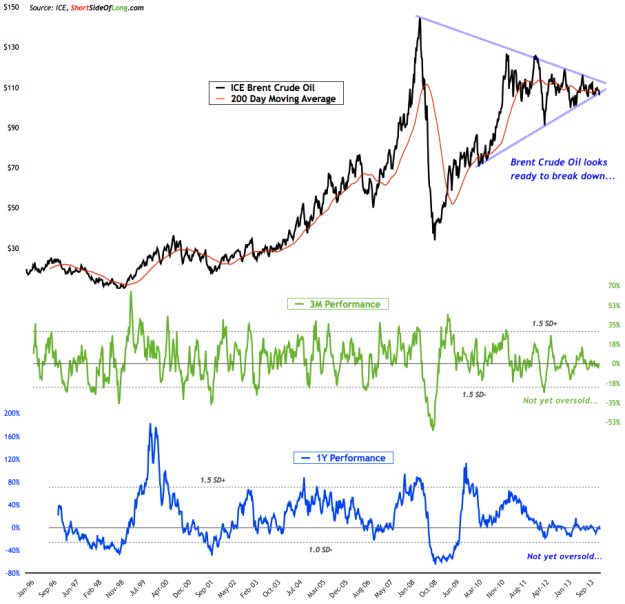
In Chart 1 seen above and Chart 2 seen below, we can see that these important industrial commodities are NOT confirming the rally. Copper has already broken down and most likely moving into its final panic sell off after a 3 year bear market. On the other hand, Brent Crude has consolidated for three years and also should drop into oversold levels before one considers a bottom to be in place.

A strong sell off in both of these commodities could be a bullish signal that a final wash out has occurred. Rarely do bear markets go on for more than three years without a meaningful rally (this outlook goes for many commodities, majority of which peaked between early to mid 2011).

Chart 2: Brent Crude is at a decision point and a breakdown looks likely!

Brent-Crude-Oil-Technicals

Latest comments

Loading next article…
Risk Disclosure: Trading in financial instruments and/or cryptocurrencies involves high risks including the risk of losing some, or all, of your investment amount, and may not be suitable for all investors. Prices of cryptocurrencies are extremely volatile and may be affected by external factors such as financial, regulatory or political events. Trading on margin increases the financial risks.
Before deciding to trade in financial instrument or cryptocurrencies you should be fully informed of the risks and costs associated with trading the financial markets, carefully consider your investment objectives, level of experience, and risk appetite, and seek professional advice where needed.
Fusion Media would like to remind you that the data contained in this website is not necessarily real-time nor accurate. The data and prices on the website are not necessarily provided by any market or exchange, but may be provided by market makers, and so prices may not be accurate and may differ from the actual price at any given market, meaning prices are indicative and not appropriate for trading purposes. Fusion Media and any provider of the data contained in this website will not accept liability for any loss or damage as a result of your trading, or your reliance on the information contained within this website.
It is prohibited to use, store, reproduce, display, modify, transmit or distribute the data contained in this website without the explicit prior written permission of Fusion Media and/or the data provider. All intellectual property rights are reserved by the providers and/or the exchange providing the data contained in this website.
Fusion Media may be compensated by the advertisers that appear on the website, based on your interaction with the advertisements or advertisers.
© 2007-2024 - Fusion Media Limited. All Rights Reserved.