
Indonesia’s GDP grew 5% year over year in the second quarter of 2017, per Badan Pusat Statistik Indonesia. This was below Bloomberg’s estimate of 5.08% and same as the growth rate in the previous quarter. It grew 4% on a sequential basis, compared to estimates of 4.07%.
President Joko Widodo had promised a 7% growth rate during his term, which is supposed to end in 2019. However, his government expects a mere 5.2% growth rate for 2017, which a few analysts say is inadequate. The central bank of Indonesia cut its key interest rate six times last year. Despite that, the economy has failed to live up to expectations, creating room for further rate cuts.
Consumer prices in Southeast Asia’s largest economy grew 3.88% in July compared with a 4.37% in June. It grew 0.22% in July on a monthly basis. Bank Indonesia targets an annual headline inflation rate in the range of 3–5% for 2017. Inflation is expected to be in the middle of the central bank’s target range (read: Indonesia's Inflation Eases: ETFs in Focus).
However, business confidence in Southeast Asia’s largest economy slowed to 103.42 in the first quarter of 2017 compared with 106.7 in the previous quarter. Moreover, consumer confidence slowed to 122.4 in June compared with 125.9 in May. However, it still remains high on a fundamental level. A reading above 100 indicates consumers are optimistic.
Although weak commodity prices were a drag on economic growth in Q2, they are stabilizing. Moreover, Widodo plans to boost infrastructure spending.
In the current scenario, let us discuss some ETFs focused on providing exposure to Indonesian equities (see all Broad Emerging Market ETFs here).
iShares MSCI Indonesia ETF EIDO
This fund is appropriate for investors looking to gain exposure to companies based in Indonesia. Thus, it offers a pure play on Indonesia.
It has AUM of $509.99 million and charges a fee of 63 basis points a year. From a sector look, Financials, Telecommunication Services and Consumer Discretionary are the top three allocations of the fund, with 32.59%, 15.34% and 14.02% exposure, respectively (as of August 3, 2017). From an individual holdings perspective, Telekomunikasi Indonesia, Bank Central Asia and Bank Rakyat Indonesia (Persero) are the top three holdings of the fund, with 13.59%, 10.61% and 9.46% allocation, respectively (as of August 3, 2017). The fund has returned 8.88% year to date but has lost 0.37% in the last one year (as of August 4, 2017). EIDO currently has a Zacks ETF Rank #2 (Buy) with a High risk outlook.
VanEck Vectors Indonesia Index ETF (AX:IDX)
This fund seeks to provide a bet on Indonesia by investing in companies based out of the nation or ones who have a great deal of business interest there.
It has AUM of $70.3 million and charges a fee of 58 basis points a year. From a sector look, Financials, Consumer Staples and Consumer Discretionary, are the top three allocations of the fund, with 27.3%, 18.3% and 14.6% exposure, respectively (as of June 30, 2017). From an individual holdings perspective, Telekomunikasi Indonesia, Bank Central Asia and Bank Rakyat Indonesia (Persero) are the top three holdings of the fund, with 8.55%, 8.30% and 6.46% allocation, respectively (as of August 4, 2017). The fund has returned 10.70% year to date but has lost 0.29% in the last one year (as of August 4, 2017). IDX currently has a Zacks Rank #2 with a High risk outlook.
Let us now compare the performance of the two funds to a broad Southeast Asia based ETF, ASEA.
Global X Southeast Asia ETF ASEA
This fund provides broad exposure to the five members of the Association of Southeast Asian Nations, Singapore, Indonesia, Malaysia, Thailand, and the Philippines. It is appropriate for investors looking for a diversified exposure to South East Asia (read: Thailand Keeps Rates Steady: ETFs in Focus).
ASEA is less popular with AUM of $13.81 million and charges a fee of 65 basis points a year. From a geographical perspective, the fund has 30.45% exposure to Singapore, 22.29% to Malaysia, 21.15% to Thailand, 19.67% to Indonesia and 6.44% to Philippines (as of June 30, 2017). Financials, Telecommunication Services and Industrials are the top three sectors of the fund, with 45.92%, 14.94% and 8.12% allocation, respectively (as of June 30, 2017). DBS Group Holdings Ltd, Oversea-Chinese Banking Ltd and United Overseas Bank Ltd are the top three holdings of the fund, with 7.48%, 7.15% and 5.92% allocation, respectively (as of August 4, 2017). The fund has returned 8.76% in the last one year and 20.97% year to date (as of August 4, 2017). ASEA currently has a Zacks Rank #3 with a Medium risk outlook.
Below is a chart comparing the year-to-date performance of the three funds.
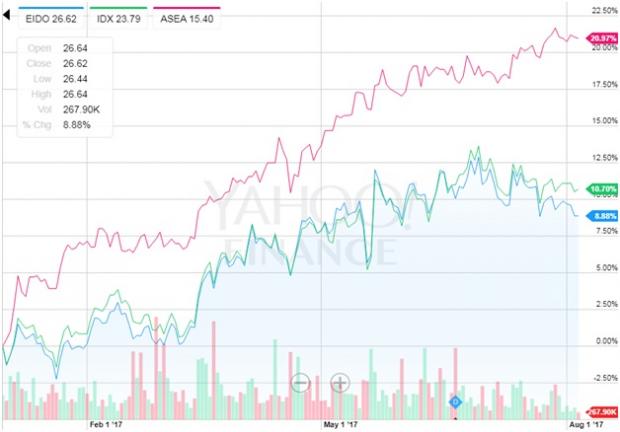
Source: Yahoo (NASDAQ:AABA) Finance
Want key ETF info delivered straight to your inbox?
Zacks’ free Fund Newsletter will brief you on top news and analysis, as well as top-performing ETFs, each week. Get it free >>
ISHARS-MS INDON (EIDO): ETF Research Reports
VANECK-INDONES (IDX): ETF Research Reports
GLBL-X SE ASIA (ASEA): ETF Research Reports
Original post
Zacks Investment Research