As has been stated here a number of times in the past, one of the fundamental tenets of technical analysis is that a trend remains in effect until it has been proven to reverse. What makes this interesting now and really over the last two weeks is the fact that as the equity indices have crept higher, the near-term uptrend showing in each has been starting to reverse down.

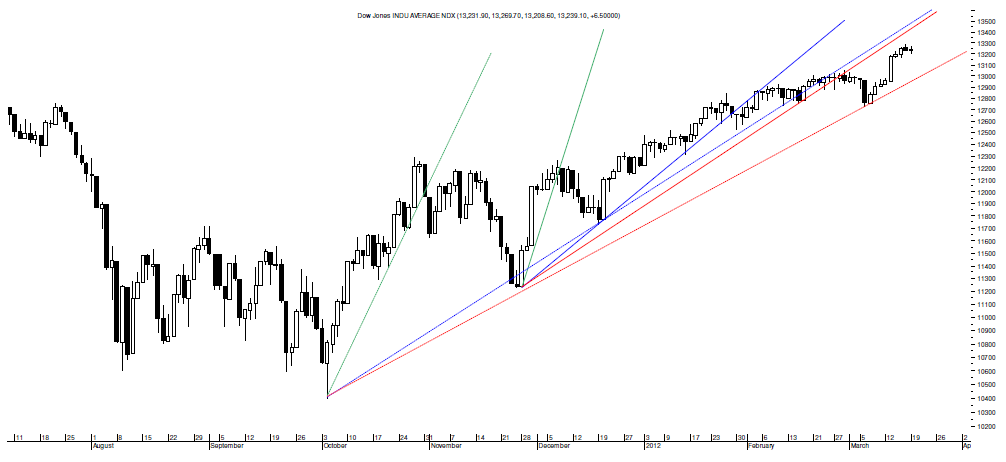
As can be seen in the chart of the Dow above, this index is, and has been for more than two weeks, below the third Bear Fan Line in solid red that marks its near-term uptrend and this provides technical proof around that aforementioned reversal of its near-term uptrend.Unless the Dow climbs back above that trendline at about 13471 today and slightly higher each day thereafter, its near-term uptrend is reversing even as the Dow climbs up to sideways.
Should the Dow remain below that third Bear Fan Line of its near-term uptrend, it puts the focus on the third Bear Fan Line to mark its intermediate-term uptrend in the dashed red trendline at about 13060 tomorrow and just a bit higher each following day.It is a potential close below that level, though, that would put the attention on that possible longer-term reversal.
Interestingly, this awkward dynamic – equity indices reversing near-term uptrends as each climbs – is showing in the Nasdaq Composite and the S&P as well and in somewhat similar form to the Dow even though the Nasdaq Composite is just below the third Bear Fan Line to mark its near-term uptrend but well above a possibly aggressive third Bear Fan Line while the S&P is positioned very similar to the Dow relative to its Bear Fan Lines.
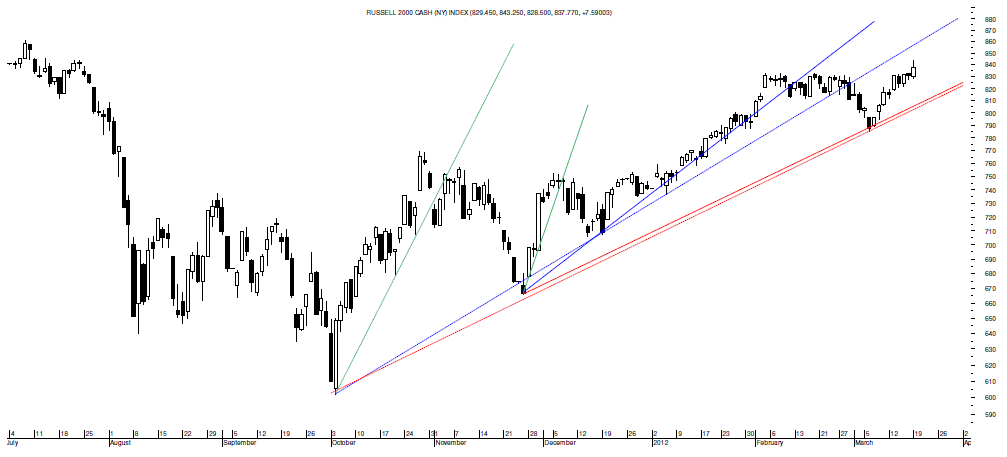
Ironically, though, this reversal has not taken place in the Russell 2000 despite its brief dance with its 50 DMA two weeks ago.In fact, it was this small cap index’s sideways trading of February followed by that plunge that created a third Bear Fan Line that is below its current trading level as can be seen in the chart on the following page.
However, what is worth noting about that third Bear Fan Line of its near-term trend is the fact that it is nearly identical to the third Bear Fan Line to mark its intermediate-term uptrend, and thus a close below that ascending level at about 808 tomorrow would carry special significance.
Specifically, a potential close below that level, and one that is not too far above the Russell 2000’s 50 DMA at this point, would strongly suggest that its chart may go quickly bearish on a simultaneous reversal of its near- and intermediate-term uptrends.

Such a bearish possibility would seem to make sense too considering that the Russell 2000 is the only equity index watched here that failed to reverse its intermediate-term downtrend born of last summer’s drop and this speaks to one word and that is sideways.
Sideways is limited relative to the Russell 2000 right now, though, in having to respect that its near-term trend is up officially and should be presumed to remain up until proven to have reversed and this, of course, will not begin to occur unless it drops below that 808-and-rising level.
What makes this interesting is the fact that while the Russell 2000 was providing a bearish sub-50 DMA cue around the rest of the equity indices two weeks ago, it could be those indices that are providing some sort of a similar cue around the Russell 2000 now and one that should be respected as much as the Russell 2000’s near-term uptrend unless each climbs above 13471, 3103 and 1432 tomorrow or slightly higher in the days to follow.
All of these tensions, then, are ironies in the equity indices worth watching.

As can be seen in the chart of the Dow above, this index is, and has been for more than two weeks, below the third Bear Fan Line in solid red that marks its near-term uptrend and this provides technical proof around that aforementioned reversal of its near-term uptrend.Unless the Dow climbs back above that trendline at about 13471 today and slightly higher each day thereafter, its near-term uptrend is reversing even as the Dow climbs up to sideways.
Should the Dow remain below that third Bear Fan Line of its near-term uptrend, it puts the focus on the third Bear Fan Line to mark its intermediate-term uptrend in the dashed red trendline at about 13060 tomorrow and just a bit higher each following day.It is a potential close below that level, though, that would put the attention on that possible longer-term reversal.
Interestingly, this awkward dynamic – equity indices reversing near-term uptrends as each climbs – is showing in the Nasdaq Composite and the S&P as well and in somewhat similar form to the Dow even though the Nasdaq Composite is just below the third Bear Fan Line to mark its near-term uptrend but well above a possibly aggressive third Bear Fan Line while the S&P is positioned very similar to the Dow relative to its Bear Fan Lines.
Ironically, though, this reversal has not taken place in the Russell 2000 despite its brief dance with its 50 DMA two weeks ago.In fact, it was this small cap index’s sideways trading of February followed by that plunge that created a third Bear Fan Line that is below its current trading level as can be seen in the chart on the following page.
However, what is worth noting about that third Bear Fan Line of its near-term trend is the fact that it is nearly identical to the third Bear Fan Line to mark its intermediate-term uptrend, and thus a close below that ascending level at about 808 tomorrow would carry special significance.
Specifically, a potential close below that level, and one that is not too far above the Russell 2000’s 50 DMA at this point, would strongly suggest that its chart may go quickly bearish on a simultaneous reversal of its near- and intermediate-term uptrends.

Such a bearish possibility would seem to make sense too considering that the Russell 2000 is the only equity index watched here that failed to reverse its intermediate-term downtrend born of last summer’s drop and this speaks to one word and that is sideways.
Sideways is limited relative to the Russell 2000 right now, though, in having to respect that its near-term trend is up officially and should be presumed to remain up until proven to have reversed and this, of course, will not begin to occur unless it drops below that 808-and-rising level.
What makes this interesting is the fact that while the Russell 2000 was providing a bearish sub-50 DMA cue around the rest of the equity indices two weeks ago, it could be those indices that are providing some sort of a similar cue around the Russell 2000 now and one that should be respected as much as the Russell 2000’s near-term uptrend unless each climbs above 13471, 3103 and 1432 tomorrow or slightly higher in the days to follow.
All of these tensions, then, are ironies in the equity indices worth watching.
