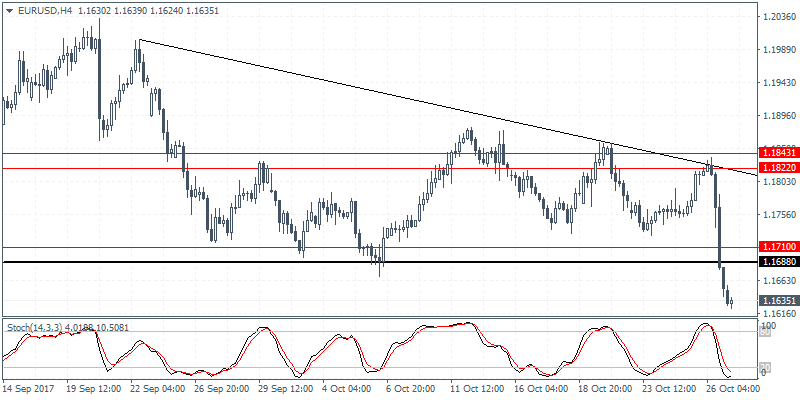
Investors sold the euro yesterday following the ECB's announcement of tapering its asset purchases to 30 billion euro a month starting January 2018 through September next year. The EUR/USD fell over 1.4% on the day after investors saw that the ECB, despite tapering maintained a cautious stand.
The British pound was also seen coming under pressure as investor uncertainty grew on the prospects of a BoE rate hike next week. This comes although the previously released GDP data was better than expected.
Looking ahead, the US preliminary GDP numbers will be coming out today. According to the economists polled, the US GDP is forecast to rise 2.5% on the quarter ending September. This comes after a 3.1% final revised GDP figures for the second quarter. However, various other estimates such as the Atlanta Fed's GDPNow and the NY Fed's Nowcast show a somewhat weaker GDP print.
EUR/USD intraday Analysis

EUR/USD (1.1635):The EUR/USD declined strongly following the ECB meeting. The reversal came as EUR/USD failed to break the resistance level near 1.1822 earlier in the day. Posting strong losses, EUR/USD broke past the support level near 1.1710 - 1.1688. In the near term, we expect to see a possible pullback to this breached support level. If resistance can be established here, EUR/USD could be seen declining to 1.1505 as the minimum downside target. This comes as price action has validated the descending triangle pattern.
USD/JPY Intra-Day Analysis

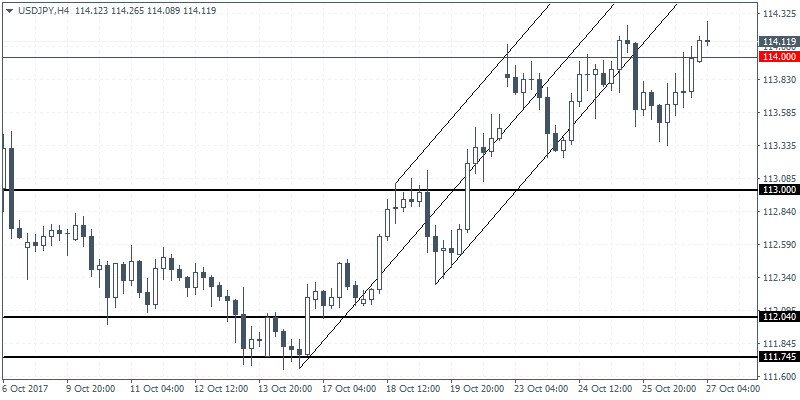
USD/JPY (114.11):The USD/JPY continues to consolidate within the ascending wedge pattern on the daily chart. Price action managed to reverse the intraday loses as the greenback closed higher on the day. With the price at resistance, this level could be breached on a strong GDP print. Failure to do so could, however, increase the downside bias in the currency pair. On the 4-hour chart, the price has managed to recover back to the previous resistance level near 114.00. However, a retest of 113.00 which serves as initial support is expected to be tested in the short term. Only a convincing close above 114.00 could see further gains in the currency pair.
XAU/USD Intraday Analysis

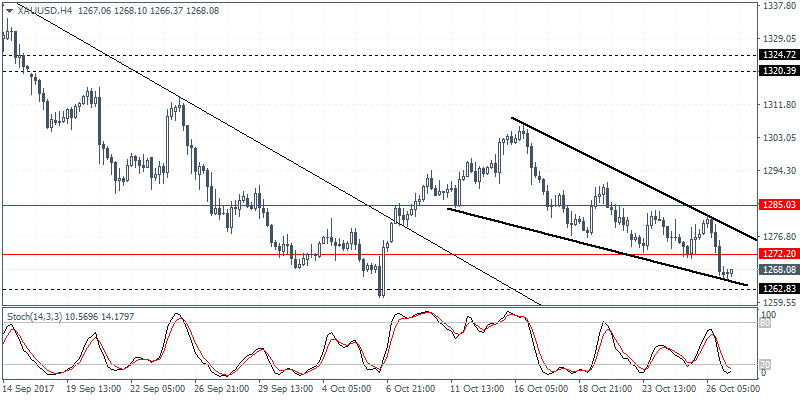
XAU/USD (1268.08):Gold prices extended the declines yesterday as price closed below the 1272 level of support. Trading closer to the previous support established at 1262, gold prices could be at risk of further declines. However, price action could be seen pushing to the upside in the near term. A close above 1272 could signal an upside bias. This will validate the descending wedge pattern that has formed and could see gold prices rising towards the 1285.00 handle. Further gains are expected only above this level, but in the short term, price action is seen to remain range bound.
