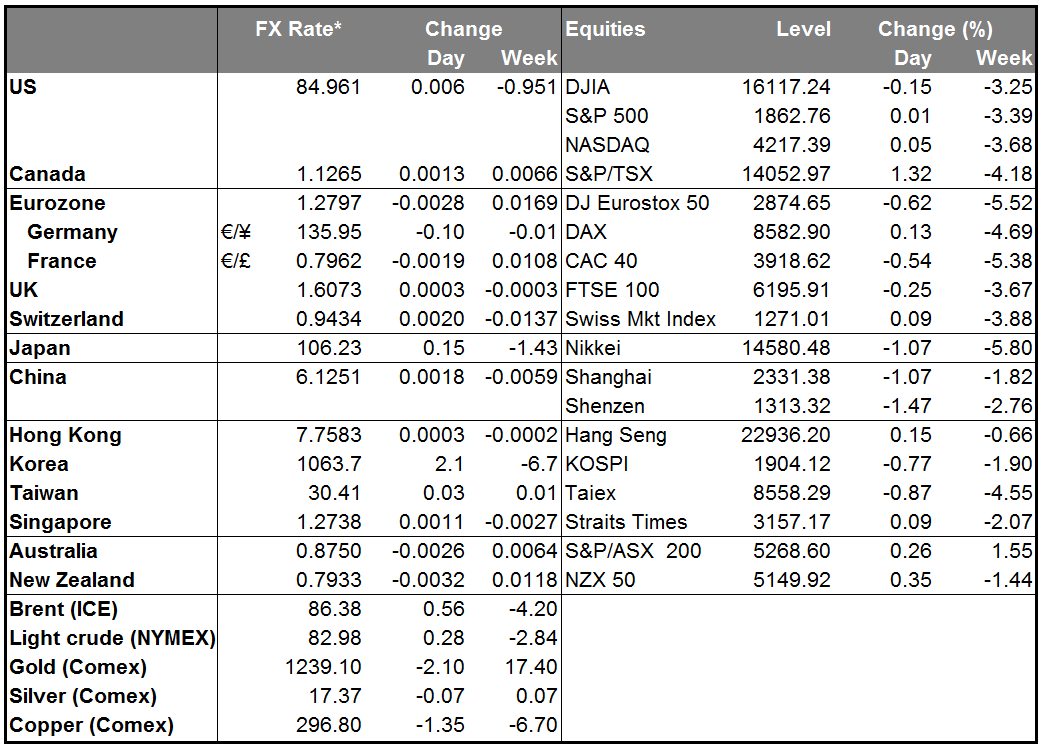
As in ice skating, usually you discard the views of the people at the extremes and listen to what the people in the middle are saying. Yesterday was an exception however, because the views of the hawkish St. Louis Fed President James Bullard proved so radical. A week ago (Oct. 10th), Bullard said that “the markets are making a mistake” and that rates would rise earlier than people think, probably at the end of Q1 2015. Yesterday he said the Fed should consider continuing with its bond-buying program, which is scheduled to end this month. “Inflation expectations are declining in the US,” he explained, adding, “we are willing to do things to defend our inflation target.” This is the first such suggestion we have had from any Fed official. Paradoxically, he also said he continues to see the first rate hike at the end of Q1, based on the expectation that the current global market turmoil won’t affect US prospects. Nonetheless, his suggestion opens up the possibility of delaying a rate hike if things don’t work out as hoped. Bullard is not currently a voting member of the FOMC.
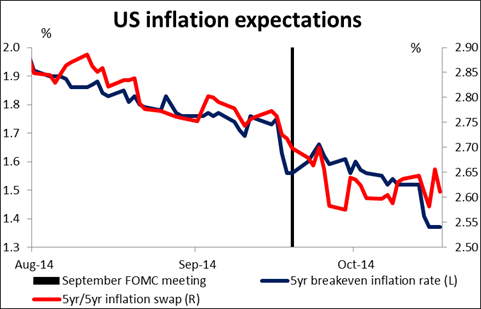
Despite Bullard’s comments, the implied interest rate on Fed fund futures actually rose 4 bps in the long end. This may have been because of the generally good US economic data: initial jobless claims were the lowest since April 2000, industrial production in September was better than expected, with manufacturing production reversing its August decline, and the Philadelphia Fed index was also better than expected. Only the NAHB index was down, although it remains in positive territory. So the picture in the US is of a generally strong economy and a central bank concerned about even the appearance of not hitting its targets.
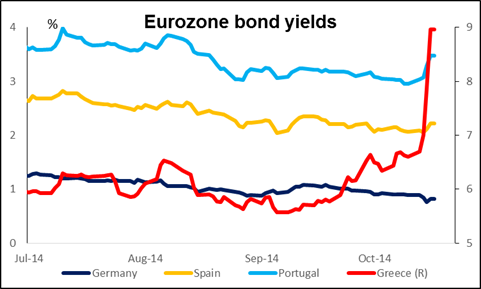
Europe and the ECB present a striking contrast to the US and the Fed. ECB Governing Council member Ewald Nowotny said the Eurozone economy “isn’t in deflation yet, but it shows clear signs of a weakening.” Nonetheless he said expectations of large-scale asset-backed security purchases were “exaggerated” and that the purchases wouldn’t start until December at the earliest. The phrase “fiddling while Rome burns” comes to mind. While the Eurozone economy slips closer to deflation, Eurozone bond yields are jumping: France 10-Year was up 13 bps yesterday, Italy 10-Year 16, Portugal 10-Year 19, and Greece 10-Year 111! Greek bond yields are up 233 bps over the last week. Rising bond yields against a background of low inflation mean future fiscal disaster. Meanwhile, the spread between Germany 10-Year and Japan 10-Year 10-year bonds has narrowed to a mere 33 bps, meaning the market thinks Europe is turning Japanese. The market is clearly demanding that the ECB do something, and yet some members of the ECB apparently see no urgency. The burden of rescuing the global economy therefore depends largely on the Fed.
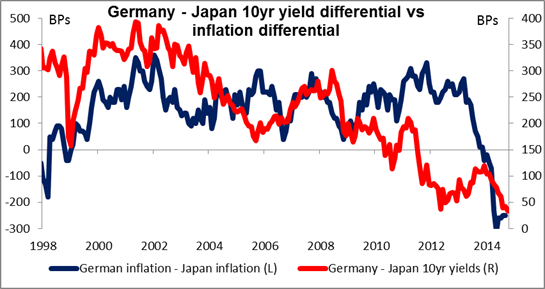
Money is not only flooding out of Eurozone bond markets – yesterday there was an outflow of USD 1.3bn from US-based European equity funds, the biggest outflow on record. Such capital flows are likely to be one of the main factors driving EUR/USD lower, in my view, as investors get increasingly fed up with the Eurozone’s inability to manage their monetary union.
Oil bounced back after falling below USD 80/bbl on speculation that OPEC will restrict supply in order to shore up prices. Given the fact that several OPEC members are virtually at war with each other, I think the idea that they are going to cooperate on this is nearly laughable. I believe this was simply a bit of profit-taking on technical factors after a sharp decline and I see oil prices falling further.
Today’s indicators: We have a relatively light day today. There are no major indicators from the Eurozone nor the UK.
In the US, housing starts and building permits for September are forecast to increase. Last time, both missed expectations and disappointed the market. It remains to be seen whether the weak pace continues in September. If the forecasts are met, it would suggest that the US economy is on a strong track and this could strengthen further USD. The preliminary University of Michigan consumer confidence sentiment for October is also coming out. The big event in the US however will be a speech by Fed Chair Janet Yellen at a Boston Fed conference on inequality.
From Canada, the inflation rate for September should shed some light on the country’s current situation. The forecast is for the rate to fall, which could prove CAD-negative and offset the impact from the recent decline in the unemployment rate.
There are several ECB speakers scheduled today: ECB Vice President Constancio, Bundesbank President Weidmann, and ECB Governing Council members Coeure and once again, Mr. Nowotny.
The Market
EUR/USD falls but rebounds from 1.2700
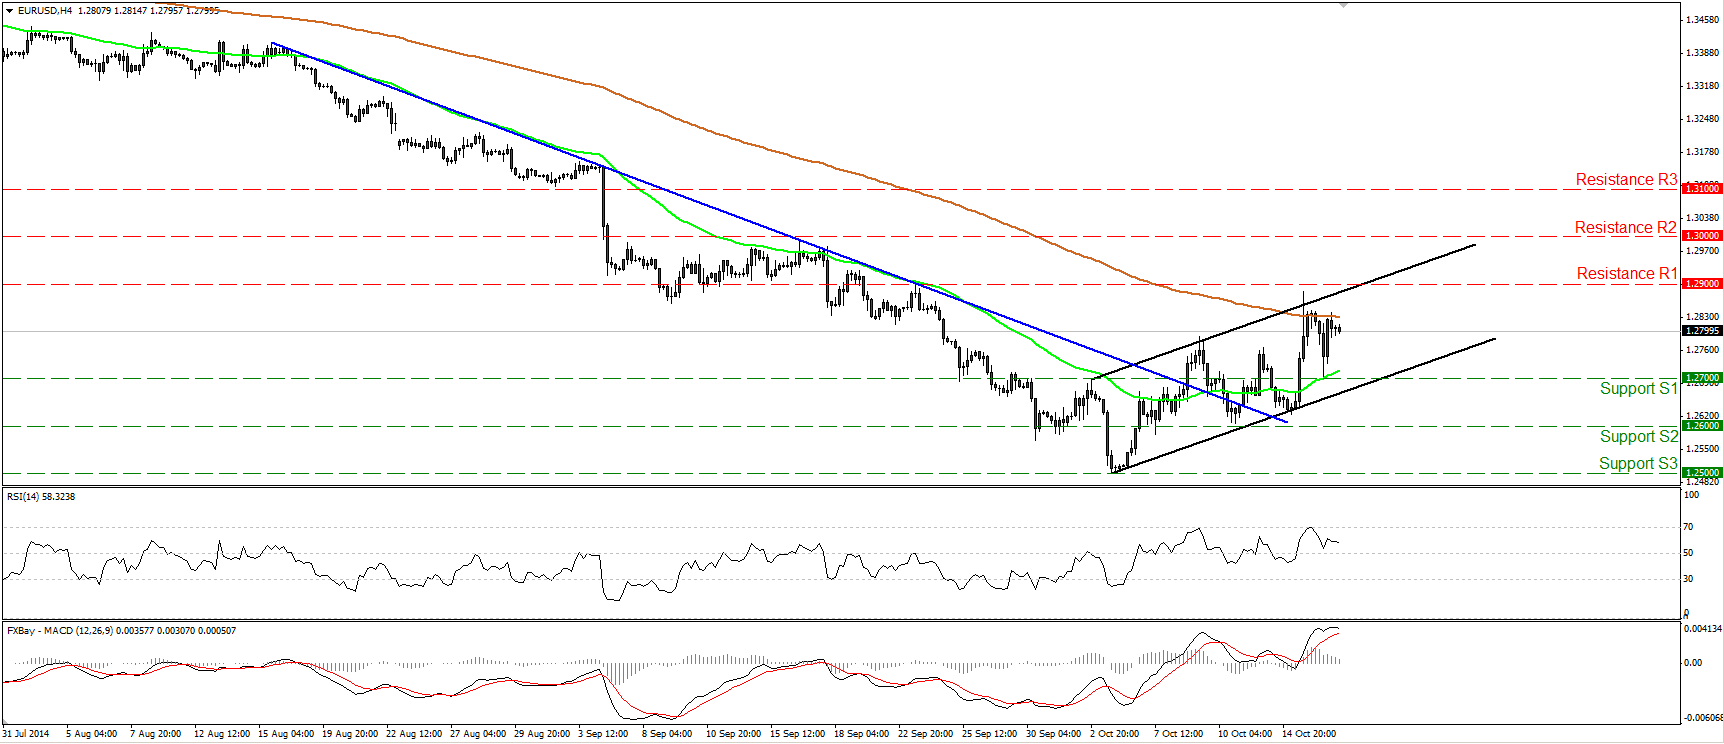
EUR/USD declined yesterday but found some buy orders near the 1.2700 (S1) line and the 50-period moving average, and rebounded. As long as the rate remains within the upside black channel and above the blue prior downtrend line, I would consider the short-term bias to remains cautiously positive. But only a clear break above the 1.2900 hurdle is the move that could trigger a strong leg up in my view, perhaps towards the psychological line of 1.3000 (R2). The RSI moved lower after hitting its 70 line, while the MACD shows signs of topping and could move below its trigger line any time soon. As a result I would be cautious of another pullback towards the 1.2700 (S1) line and the lower bound of the channel. As for the broader trend, on the daily chart the price structure still suggests a downtrend, thus I still see the near-term advances as a corrective phase of the longer-term down path.
• Support: 1.2700 (S1), 1.2600 (S2), 1.2500 (S3)
• Resistance: 1.2900 (R1), 1.3000 (R2), 1.3100 (R3)
Could USD/JPY fall below 105.00?
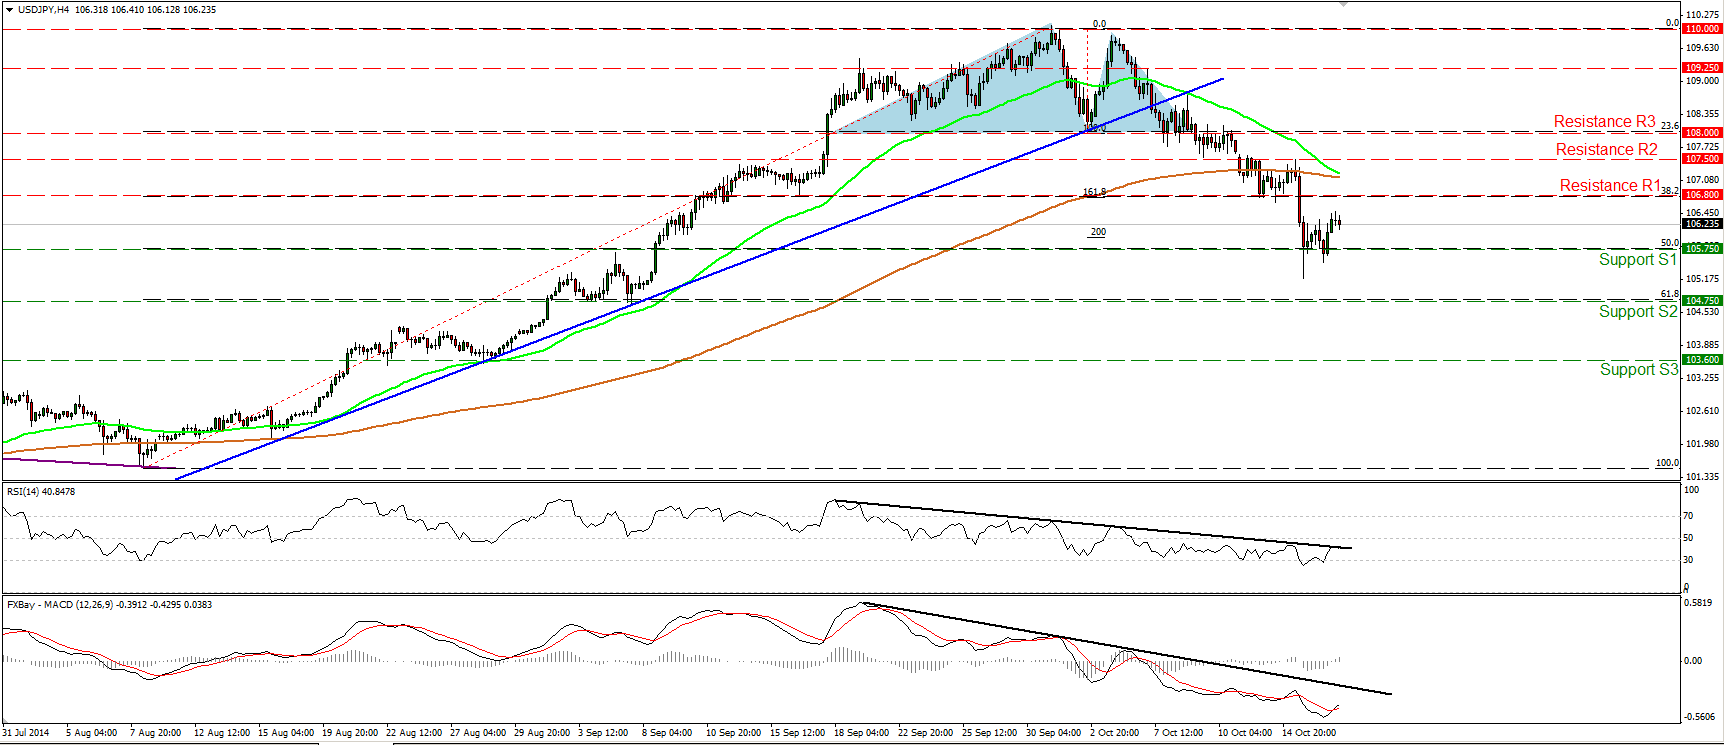
USD/JPY rebounded somewhat yesterday after finding buyers below the 50% retracement level of the 8th August – 1st October up move. However, I still believe that the near-term bias remains to the downside and I would expect another dip below 105.75 (S1) to pave the way for the next support at 104.75 (S2), which lies near the 61.8% retracement level of the aforementioned advance. Both our near-term oscillators remain below their downside black resistance lines, supporting the negative picture. Moreover, the 50-period moving average is too close to the 200-one and could cross below it in the close future, adding another bearish sign to the near-term picture of USD/JPY.
• Support: 105.75 (S1), 104.75 (S2), 103.60 (S3)
• Resistance: 106.80 (R1), 107.50 (R2), 108.00 (R3)
GBP/USD slightly below the resistance of 1.6130
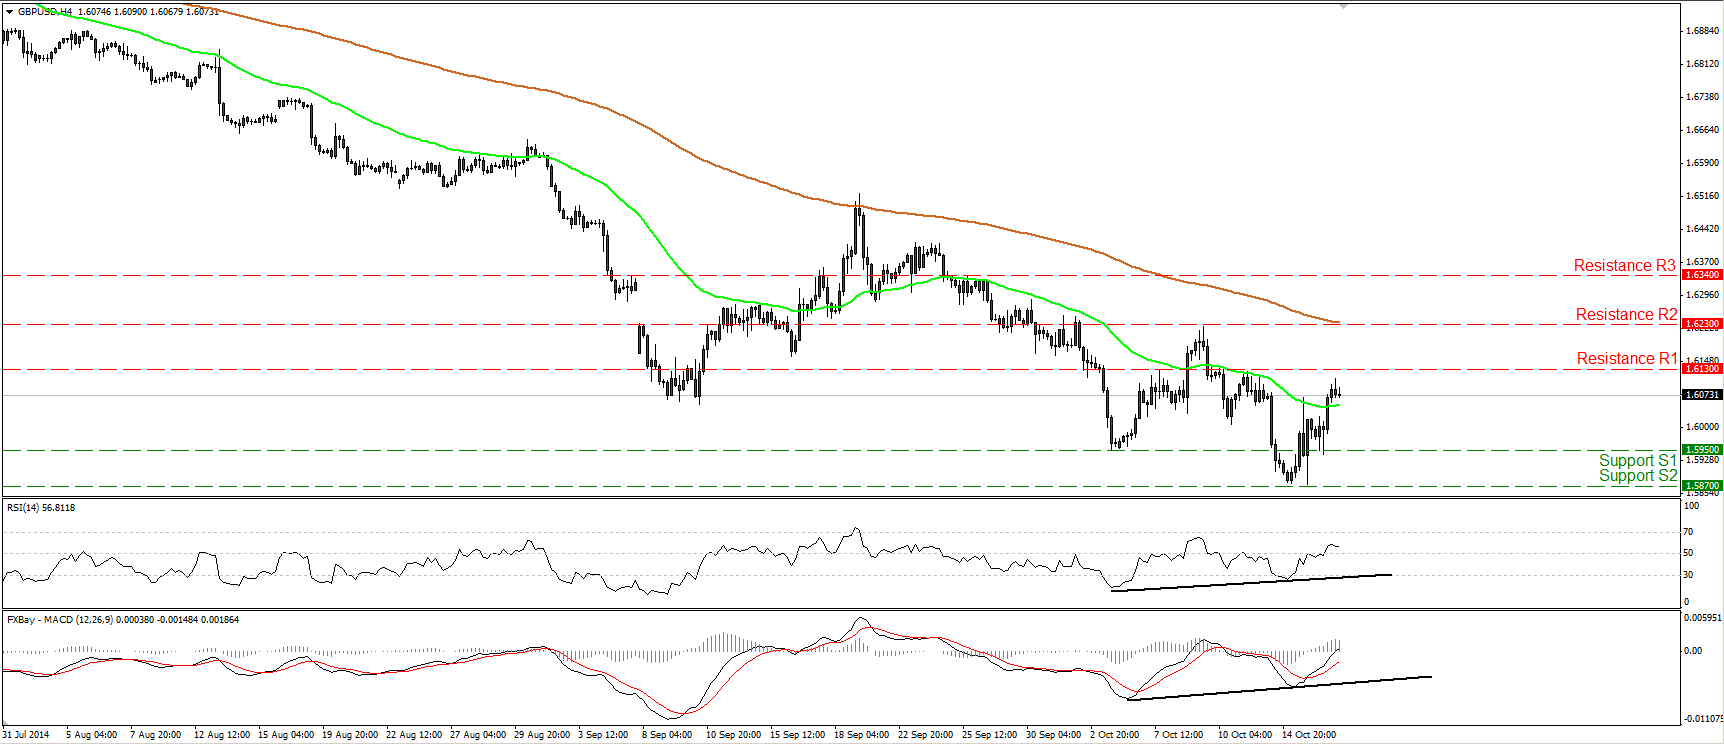
GBP/USD moved higher on Thursday after finding support near the 1.5950 (S1) area. Today, during the early European morning, the pair is trading slightly below the resistance hurdle of 1.6130 (R1). A clear and decisive move above that line could pave the way towards the next obstacle at 1.6230 (R2), which now coincides with the 200-period moving average. Our near-term momentum studies show that the RSI remains above its 50 line and that the MACD, already above its trigger, turned positive. This confirms yesterday’s positive momentum. As far as the longer-term trend is concerned, I still think that as long as Cable remains below the 80-day exponential moving average, the picture is negative overall. Nevertheless, I also see positive divergence between the daily momentum indicators and the price action, something that indicates decelerating bearish momentum. I would wait for more actionable negative signs before getting again confident about the overall downtrend.
• Support: 1.5950 (S1), 1.5870 (S2), 1.5720 (S3)
• Resistance: 1.6130 (R1), 1.6230 (R2), 1.6340 (R3)
WTI shoots up after triggering buy orders below 80.00
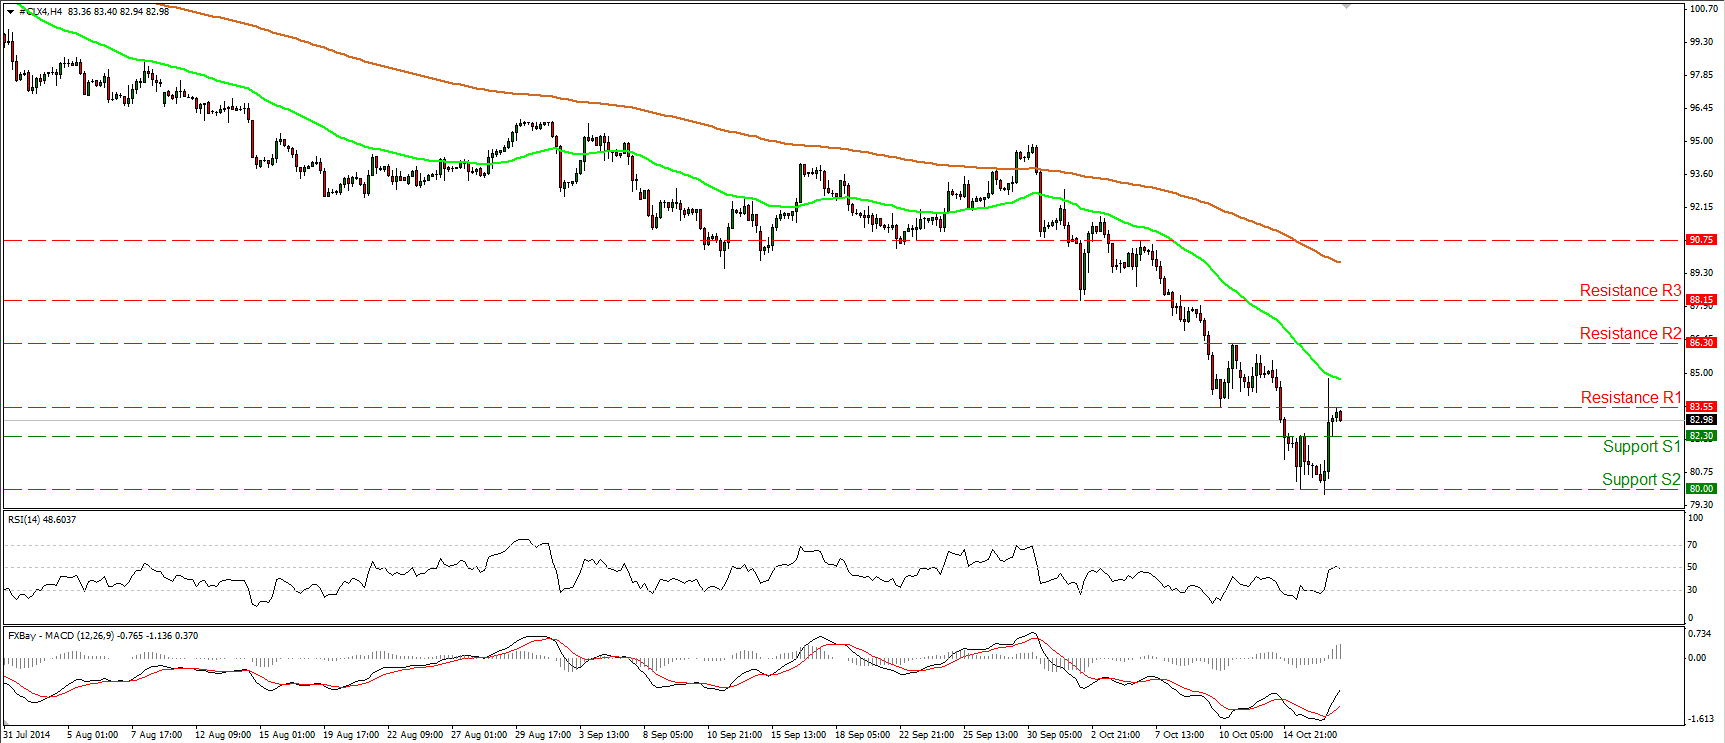
WTI shot up yesterday after waking up some bulls fractionally below the psychological line of 80.00 (S2). The price structure remains lower highs and lower lows below both the 50- and the 200-period moving averages, keeping the downtrend intact. However, given the strong rebound from the 80.00 (S2) zone, I would prefer to adopt a wait and see approach for now. On the daily chart, the 14-day RSI exited its oversold field, while the daily MACD seems to be bottoming. These momentum signs give me extra reasons to remain neutral. I would prefer to see a strong move below the psychological hurdle of 80.00 (S2) before getting more confident on the downside. Such a move could trigger extensions towards our next support barrier at 77.50 (S3), determined by the lows of June 2012.
• Support: 82.30 (S1), 80.00 (S2), 77.50 (S3)
• Resistance: 83.55 (R1), 86.30 (R2), 88.15 (R3)
Gold pulls back near the 200-period EMA
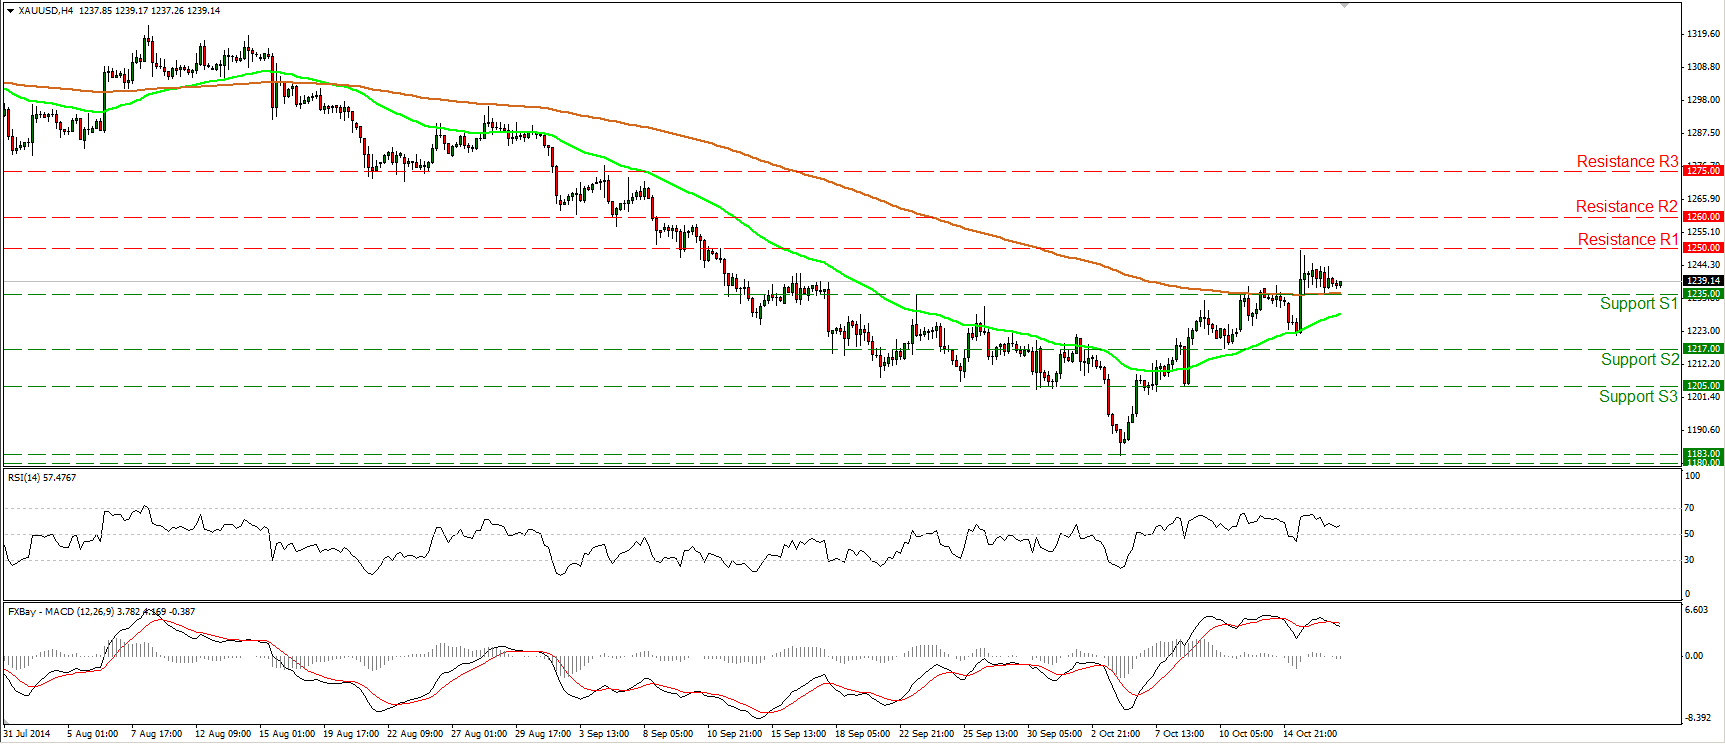
Gold moved marginally lower on Thursday and near the European opening is slightly above the 1235 (S1) line and the 200-period moving average. I still expect the bulls to pull the trigger and target the resistance obstacle of 1260 (R2). On the daily chart, the 14-day RSI remains above its 50 line while the daily MACD, already above its trigger line, is getting closer to its zero line and could get a positive sign in the near future. This supports the scenario for further advances in the near future. Nonetheless, coming back to the 4-hour chart, the RSI moved lower after finding resistance below its 70 line and the MACD topped and crossed below its trigger, thus we may experience further pullback before the buying pressure prevails again.
• Support: 1235 (S1), 1217 (S2), 1205 (S3)
• Resistance: 1250 (R1), 1260 (R2), 1275 (R3)

