The week the Bureau of Labor Statistics (BLS) issued their Job Openings and Labor Turnover Survey (JOLTS) - a report mostly ignored for good reason - it is hard to interpret the good and bad news in the report. Besides this report features chaotic views of data sets which would put most people to sleep.
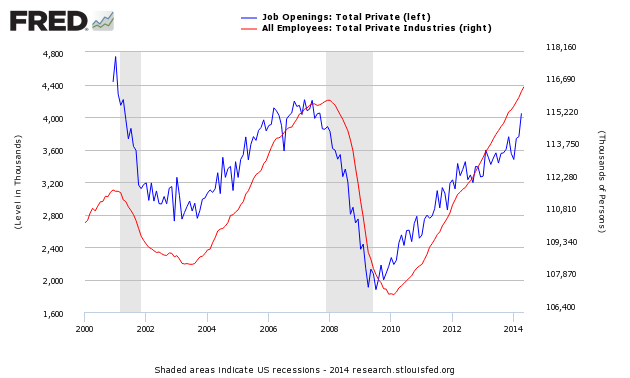
I will avoid subjecting you to a discussion of the internals of this JOLTS report, but you can [read about it here]. The bottom line is that there was a significant jump in the number of unadjusted private job openings - one of the most predictive elements of JOLTS (see the significant jump of the blue line below). Changes in job openings has led changes in employment cycles since the beginning of this data series.
Seasonally Adjusted Private Jobs Openings from JOLTS (blue line, left axis) compared to BLS Non-farm Private (red line, right axis)
This data series historically is very noisy which likely is a result of data gathering issues and/or seasonal adjustments. Further:
- the data (like other BLS labor reports) has significant backward revision
- it is a relatively new report and does not have many economic cycles to prove its accuracy.
So starting with potentially a good data set, is it possible to correlate this good news? Most employment indices are rear view mirrors, and do not suggest if employment growth will strength or decline in the future. I am only aware of two predictive employment indices - one by the Conference Board and one by Econintersect.
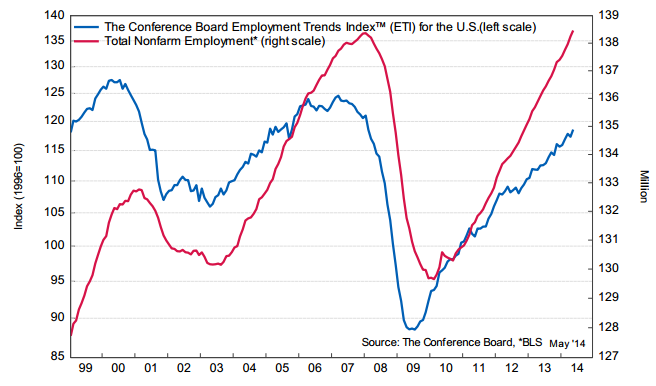
This past Monday, the Conference Board Employment Trends Index™ (ETI) showed employment should continue to strengthen over the next six months. This index is based on eight employment indicators (including job openings in JOLTS). Basically the index uses employment trends to forecast the future.
Our Econintersect Employment Index, which uses non-labor and mostly non-monetary economic pulse points, is also forecasting growth. This index is based on a non-monetary version of Okun's Law.
Comparing BLS Non-Farm Employment YoY Improvement (blue line, left axis) with Econintersect Employment Index YoY Improvement (red line, left axis) and The Conference Board ETI YoY Improvement (yellow line, right axis)
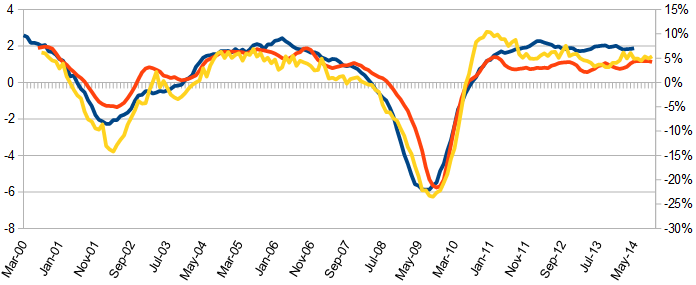
The graph above offsets the Conference Board ETI by 5 months. Econintersect forecast employment strengthening beginning in February (red line) but will weaken again at the end of 2014. Note that:
- the rate of growth of the Conference Board’s Employment Index and Econintersect Employment Index has been in the same range for the last two years.
- Econintersect's index has a slight improving bias for the past 3 years, while the Conference Boards ETI has a slight declining bias.
At this point, the employment forecasting indices are suggesting better growth is coming.
Other Economic News this Week:
The Econintersect Economic Index for June 2014 is showing continued growth acceleration. Outside of our economic forecast - we are worried about the consumer's ability to expand its consumption as the ratio between income and expenditures are near all time highs. The GDP contraction for 1Q2014 is a paper contraction as GDP is determined by playing games with accounts. No serious element of the economy was in contraction (except government spending) which is already expanding in the 2Q2014.
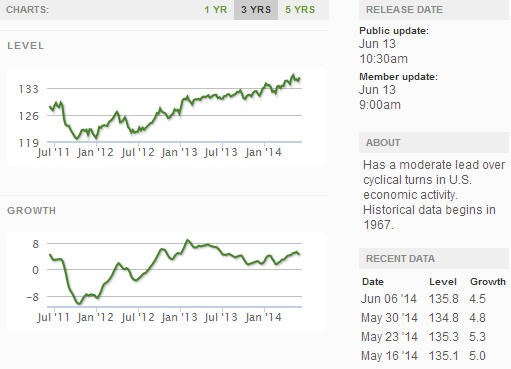
The ECRI WLI growth index value has been weakly in positive territory for many months - but now in a noticeable improvement trend. The index is indicating the economy six month from today will be slightly better than it is today.
Current ECRI WLI Growth Index
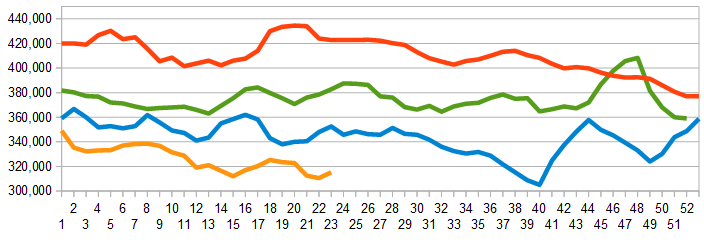
The market was expecting the weekly intial unemployment claims at 300,000 to 340,000 (consensus 309,000) vs the 317,000 reported. The more important (because of the volatility in the weekly reported claims and seasonality errors in adjusting the data) 4 week moving average moved from 310,500 (reported last week as 310,250) to 315,250.
Weekly Initial Unemployment Claims - 4 Week Average - Seasonally Adjusted - 2011 (red line), 2012 (green line), 2013 (blue line), 2014 (orange line)
Bankruptcies this Week: Florida Gaming, Veris Gold and its Canadian-based and United States based subsidiaries (Chapter 15), privately-held Natrol
Click here to view the scorecard table below with active hyperlinks
Weekly Economic Release Scorecard:
