The SPDR Gold Shares (NYSE:GLD) has increased 6.3% since December 15, 2015. The U.S. Federal Reserve hiked its interest rate the next day and made its second hike for this cycle two weeks ago. This gain against the rate hike grain SHOULD be the headline for GLD and a relatively positive one for gold’s resilience going forward… Instead, the main headline for now is that GLD collapsed mightily from a 28-month high set over the summer.
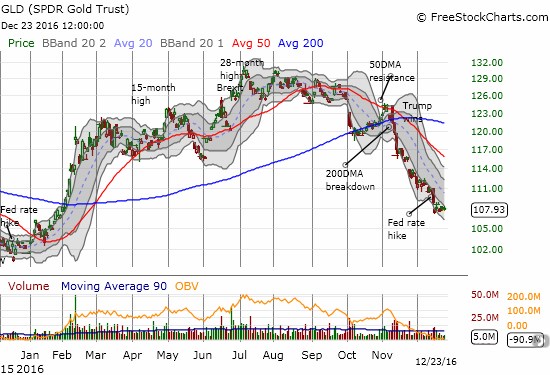
SPDR Gold Shares (GLD) is up 6.4% for the year but down 17.1% from its 28-month high. Confirmed resistance at the 50DMA and a 200DMA breakdown confirmed a topping pattern.
The writing was on the wall for GLD starting with the summer high, but I first focused on finding a spot for playing a bounce in the middle of the sell-off.
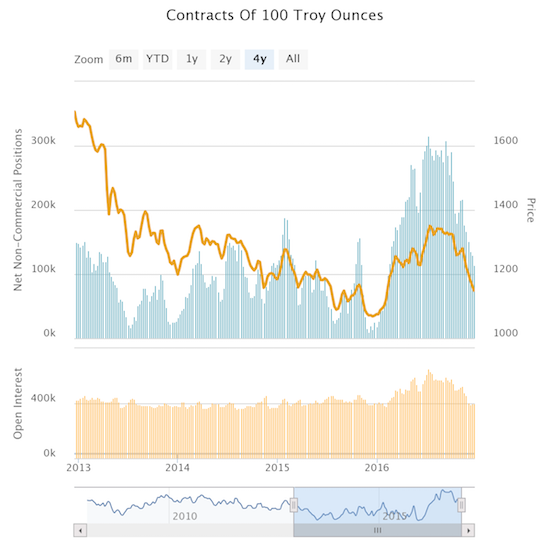
Speculator positioning has dropped consistently from the summer highs and now sits at levels last seen in February.
The chart above suggests that gold will not regain former momentum until speculators get back on board.
In the meantime, the prospects for the next Fed rate hike are murky.
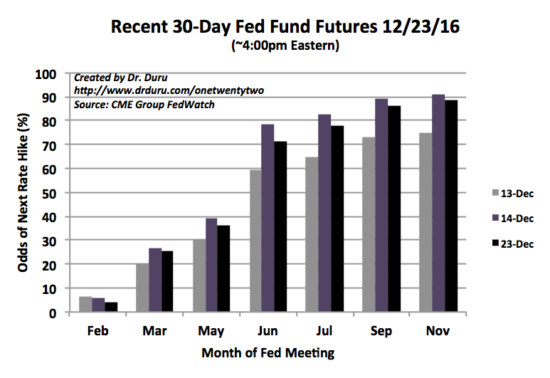
The market does not expect the Fed rate hike until June, 2017. The market is even starting to waver on how soon to expect that hike.
Regardless, a LOT can and will happen in the next six months; yet, the market’s moves in the past two weeks imply a high level of certainty for what is coming in this time. The biggest wildcard out there sits with President-elect Trump’s actual policies.
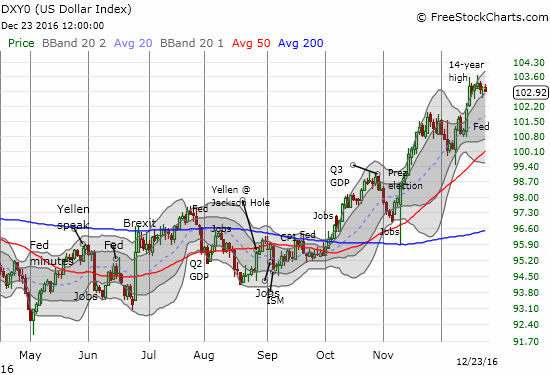
The U.S. dollar index (DXY0) broke out to a new 14-year high in reaction to the Fed’s rate hike and statements on monetary policy.
In recent posts on GLD, I noted the challenge of “term pollution” from searches using “buy gold” that do not refer to the precious metal. I am now actively tweaking my methodology to accommodate this pollution. I may have stumbled upon a satisfactory substitute with topics in Google Trends. The charts below show the trends in the topic “gold as an investment.”
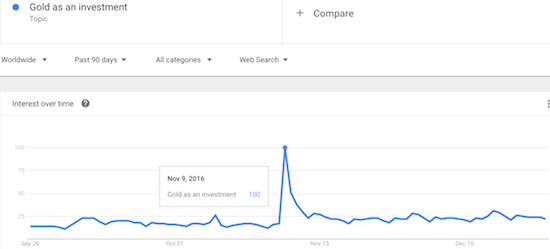
On the day after the U.S. Presidential election (Wednesday, November 9th), interest in gold as an investment experienced a significant spike.
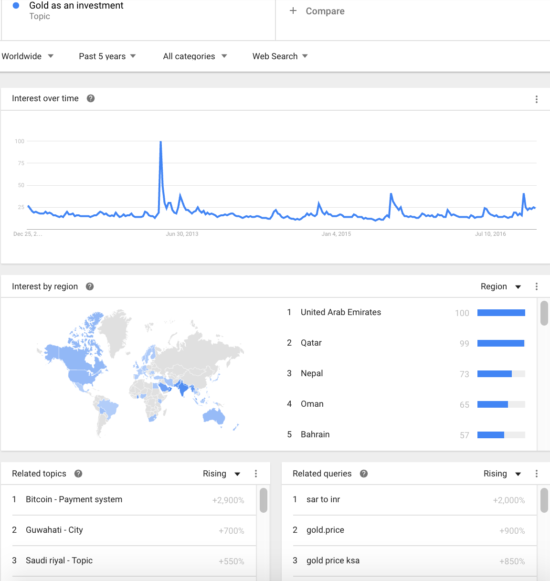
The spike in investment interest was also significant relative to previous spikes in interest, including Brexit in late June.
The latest spike in interest in gold as an investment corresponds directly with the fallout from the election of Donald Trump. If anything, the interest in gold related to the rupee’s manipulation has likely prevented gold from falling further faster that it already has. I am assuming that holders of Indian rupees are looking to gold as a potential alternative to shield themselves from further government machinations with the currency.
Given the context, fundamental and technical, the sentiment spike confirms that gold has likely topped out for the time-being. In other words, given a spike in interest was unable to turn the tide, I am assuming the path of least resistance will firmly remain downward. GLD’s low from 2015 is back in play.
A look back at the last major spike in interest in gold further supports the need for me to make this adjustment in my interpretation of the sentiment signal.
On the surface, the April, 2013 episode revealed a weakness in the usefulness of the contrary nature of the sentiment signal. However, the important context I dismissed too easily during that episode was that GLD suffered a major technical breakdown. Overall, that episode for GLD served as a reminder of my experience with major technical breakdowns: they tend to generate follow-through before a complete reversal and end to the breakdown.
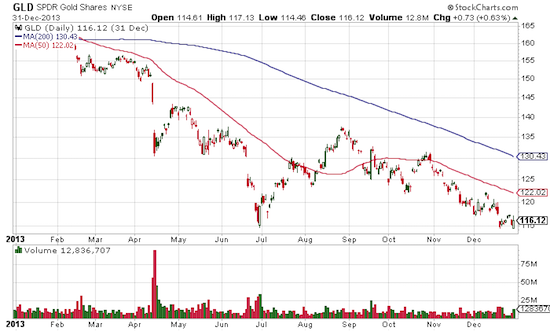
SPDR Gold Shares (GLD) had a very rough 2013 – a brutal sell-off from which it has yet to recover.
Be careful out there!
Full disclosure: long GLD
