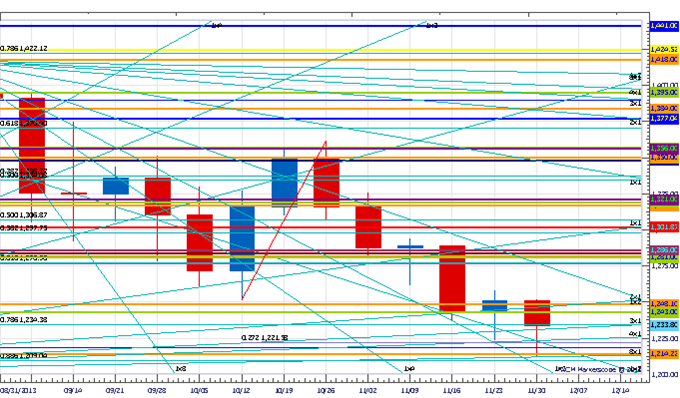
- XAU/USD traded this week to its lowest level since late June before finding support at the 1st square root relationship of the year’s low
- Our broader trend bias is negative in the metal while below last week’s high at 1258
- A daily close under 1219 signals a resumption of the broader decline
- A Fibonacci time relationship related to the August high and June lowcould influence over the next few days
- A daily close back over 1258 would turn us positive on the metal.
Weekly XAU/USD Strategy: Like being square here into this turn window. A close over 1258 would get us long.
|
Instrument |
Support 2 |
Support 1 |
Spot |
Resistance 1 |
Resistance 2 |
|
XAU/USD |
1180 |
*1219 |
1233 |
*1258 |
1282 |
--- Written by Kristian Kerr, Senior Currency Strategist for DailyFX.com
Chart Created using Marketscope – Prepared by Kristian Kerr.
This publication attempts to further explore the concept that mass movements of human psychology, as represented by the financial markets, are subject to the mathematical laws of nature and through the use of various geometric, arithmetic, statistical and cyclical techniques a better understanding of markets and their corresponding movements can be achieved.
