Yesterday was a very good day for gold, but today is somewhat the opposite. The big picture, however, is encouraging. It suggests that gold should is about to embark on another major upleg:
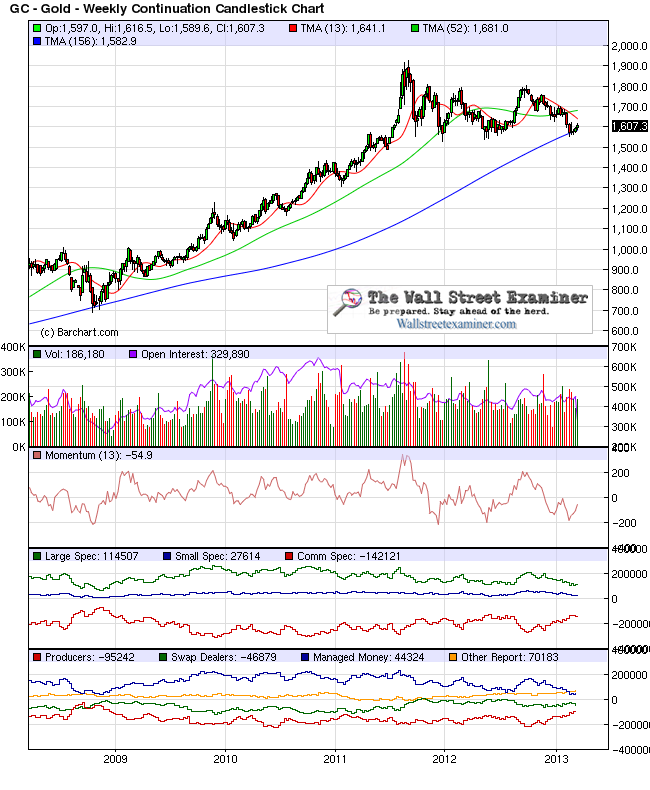
This 5 year weekly chart shows price trends with certain key moving averages, along with a momentum indicator and data from the Commitment of Traders (COT) weekly reports of futures positions. The COT reports break out not only the positions of large and small speculators and commercial hedgers, but section further into producers, managed money, swap dealers and others. The chart reveals some very bullish long term indications.
First, the price of gold touched the 3 year triangular moving average in March. The last time it did so was late 2008, from where it commenced a 3 year run of more than 1,100 points.
Next, 13 week momentum, an intermediate term indicator, reached the area where it bottomed at the last two intermediate lows in 2011 and 2012. It’s just a hair above the level it reached in 2008 at that bottom.
Then we get a really interesting part: how futures traders are positioned. The data is broken down by Producers, Swap Dealers, Managed Money, and Others. The two most interesting are the Producers, the guys that dig the stuff out of the ground, and the managed money, the commodity fund professionals who we would normally consider a fade, that is the crowd doing the opposite of what they should be. They’re the “dumb money,” so to speak.
The producers now have a short position of just over 95,000 contracts. But the producers are always short. They hedge the price of their production. The relevant question is “How short are they?” The answer is, “Not very.” Each time their short position has gotten this small since 2009, it has been associated with an intermediate bottom in price. As a percentage of the open interest (not shown), their short position today is even smaller than it was at the 2008 bottom.
By the same token, managed money, which is always net long, and is now at 44,000 contracts, has the smallest long position since the 2008 bottom. Most managers have been shaken out of their long positions. Managed money typically follows the trend. Their long positions typically peak in excess of 200,000 contracts at intermediate tops. That’s a lot of buying power waiting to get back in. If and when the market starts to move, they will be pushing prices higher as they re-establish positions.
The very long term view only supports this thesis.
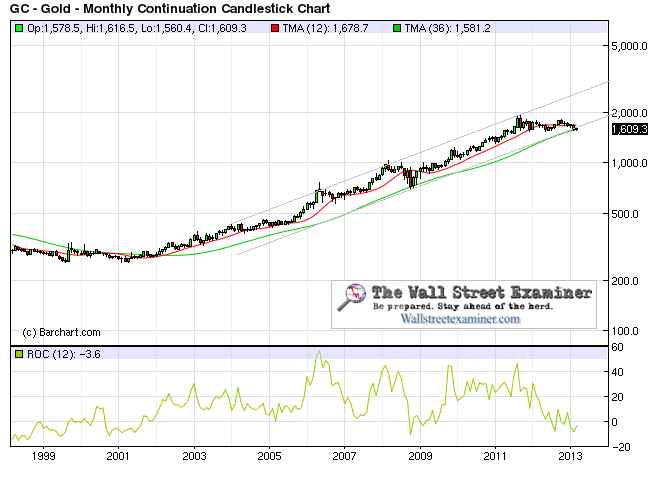
Gold has come down not only to the 3 year moving average, which was the relaunch point for the uptrend in 2008, it’s also the bottom of the equal vertical width channel. Long term trends tend to move at a constant percentage rate over the very long haul. The equal vertical width channel establishes the normal parameters of intermediate swings within the trend. It’s drawn by first connecting the highs in the uptrend, and then drawing a parallel line from the major bottom in 2008. It shows that the market has reached the same counter trend level relative to the normal rate of gain as it did in 2008, before the uptrend resumed.
Finally, the rate of change graph illustrates this on an oscillator. It shows that the 12 month rate of change has reached the same lower extreme as at the market bottom in 2001, and the countertrend bottom in 2008.
There may be arguments to be made that the uptrend is about to be broken, but the weight of this evidence suggests the opposite. Gold is ready to embark on a new major upleg that could carry it to near $3000 an ounce in 2014.
- English (UK)
- English (India)
- English (Canada)
- English (Australia)
- English (South Africa)
- English (Philippines)
- English (Nigeria)
- Deutsch
- Español (España)
- Español (México)
- Français
- Italiano
- Nederlands
- Português (Portugal)
- Polski
- Português (Brasil)
- Русский
- Türkçe
- العربية
- Ελληνικά
- Svenska
- Suomi
- עברית
- 日本語
- 한국어
- 简体中文
- 繁體中文
- Bahasa Indonesia
- Bahasa Melayu
- ไทย
- Tiếng Việt
- हिंदी
If You Believe Indications, Then Gold Is Headed For $3000 By 2014
Published 03/25/2013, 06:33 AM
Updated 05/14/2017, 06:45 AM
If You Believe Indications, Then Gold Is Headed For $3000 By 2014
Latest comments
Loading next article…
Install Our App
Risk Disclosure: Trading in financial instruments and/or cryptocurrencies involves high risks including the risk of losing some, or all, of your investment amount, and may not be suitable for all investors. Prices of cryptocurrencies are extremely volatile and may be affected by external factors such as financial, regulatory or political events. Trading on margin increases the financial risks.
Before deciding to trade in financial instrument or cryptocurrencies you should be fully informed of the risks and costs associated with trading the financial markets, carefully consider your investment objectives, level of experience, and risk appetite, and seek professional advice where needed.
Fusion Media would like to remind you that the data contained in this website is not necessarily real-time nor accurate. The data and prices on the website are not necessarily provided by any market or exchange, but may be provided by market makers, and so prices may not be accurate and may differ from the actual price at any given market, meaning prices are indicative and not appropriate for trading purposes. Fusion Media and any provider of the data contained in this website will not accept liability for any loss or damage as a result of your trading, or your reliance on the information contained within this website.
It is prohibited to use, store, reproduce, display, modify, transmit or distribute the data contained in this website without the explicit prior written permission of Fusion Media and/or the data provider. All intellectual property rights are reserved by the providers and/or the exchange providing the data contained in this website.
Fusion Media may be compensated by the advertisers that appear on the website, based on your interaction with the advertisements or advertisers.
© 2007-2025 - Fusion Media Limited. All Rights Reserved.
