With a near perfect track record, the yield curve remains one of the best recession predictors available to economists. The reason is very simple: short-term interest rates, which are directly influenced by Fed policy, remain one of the most important variables affecting the economy. It therefore makes sense to revisit the yield curve from time to time to gauge its status. Let’s start by looking at the widest spread, that of the 30-Year and 3-Month treasury:
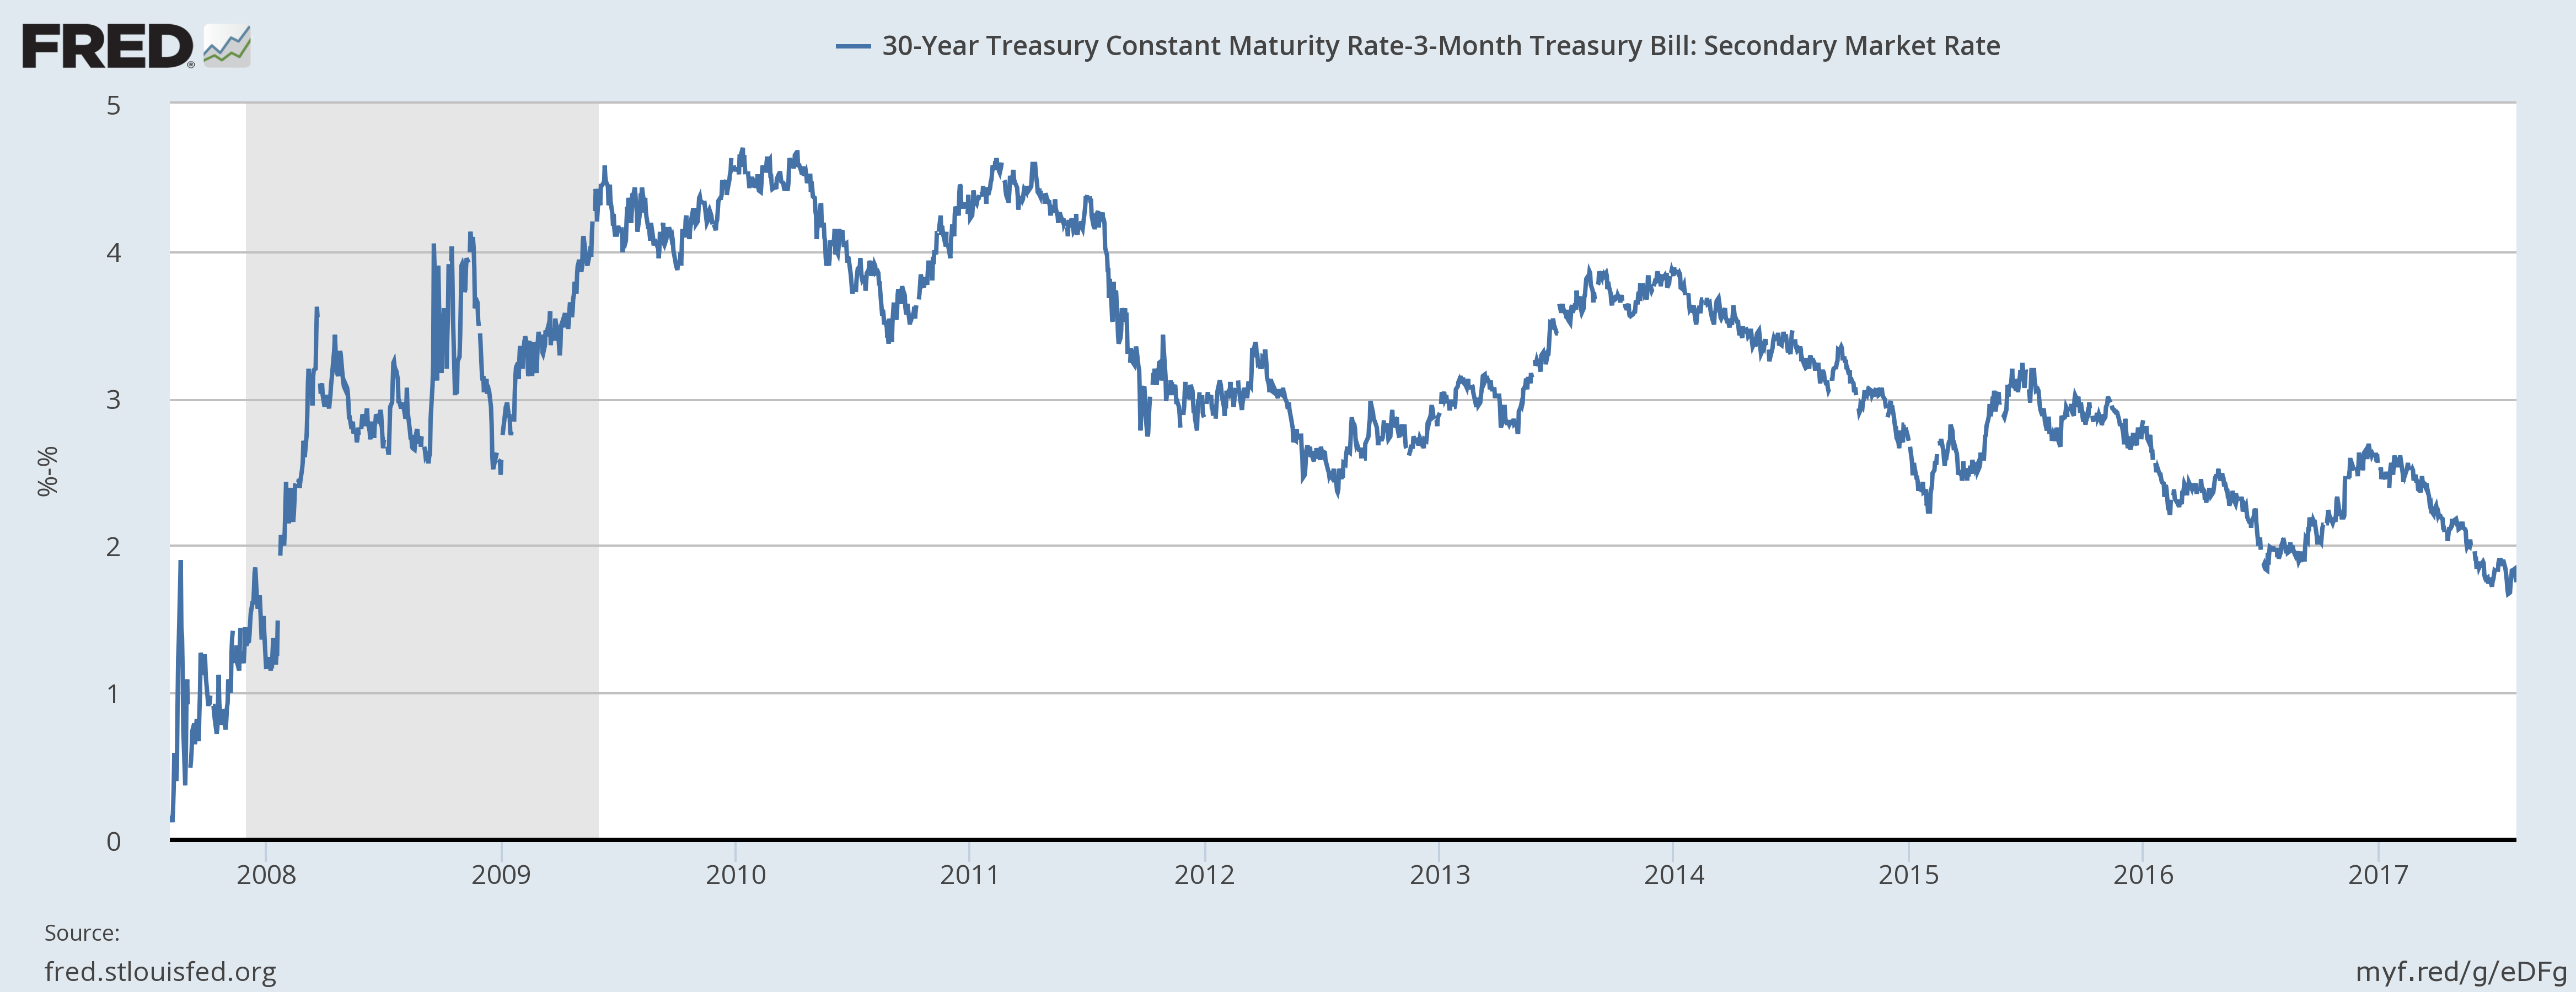
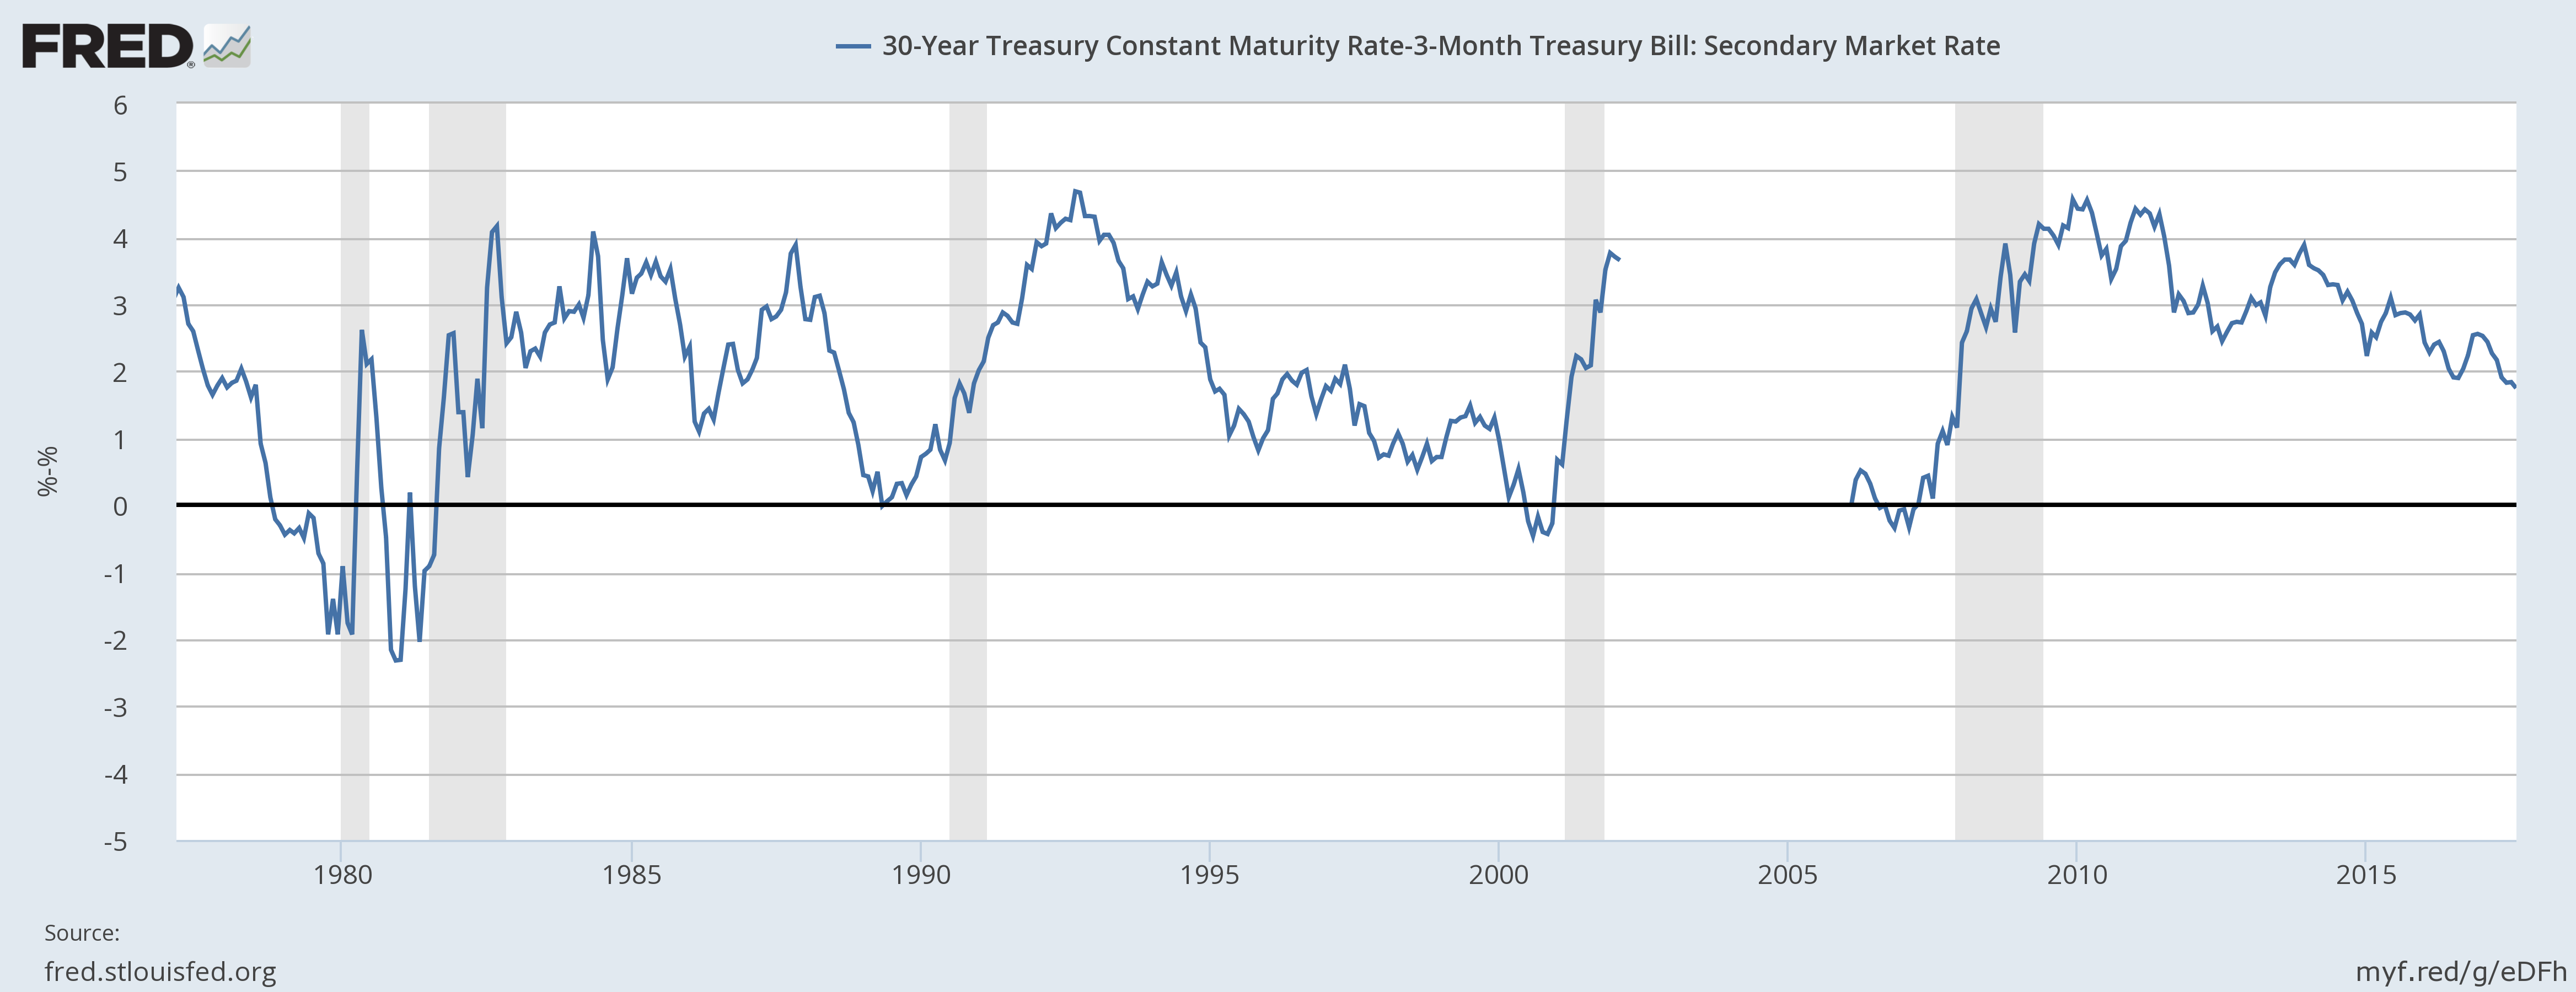
The top chart shows the 30 year-3 months spread since slightly before the start of the last recession. It traded between 400-450 basis points right after the last recession. Over the last 8 years, the spread has moved consistently lower and now stands a little below 200 basis points. The bottom chart places the current spread into a longer historical context. At current levels, the curve has a long way to go before inverting.
Most of the movement has occurred in the short end of the curve:
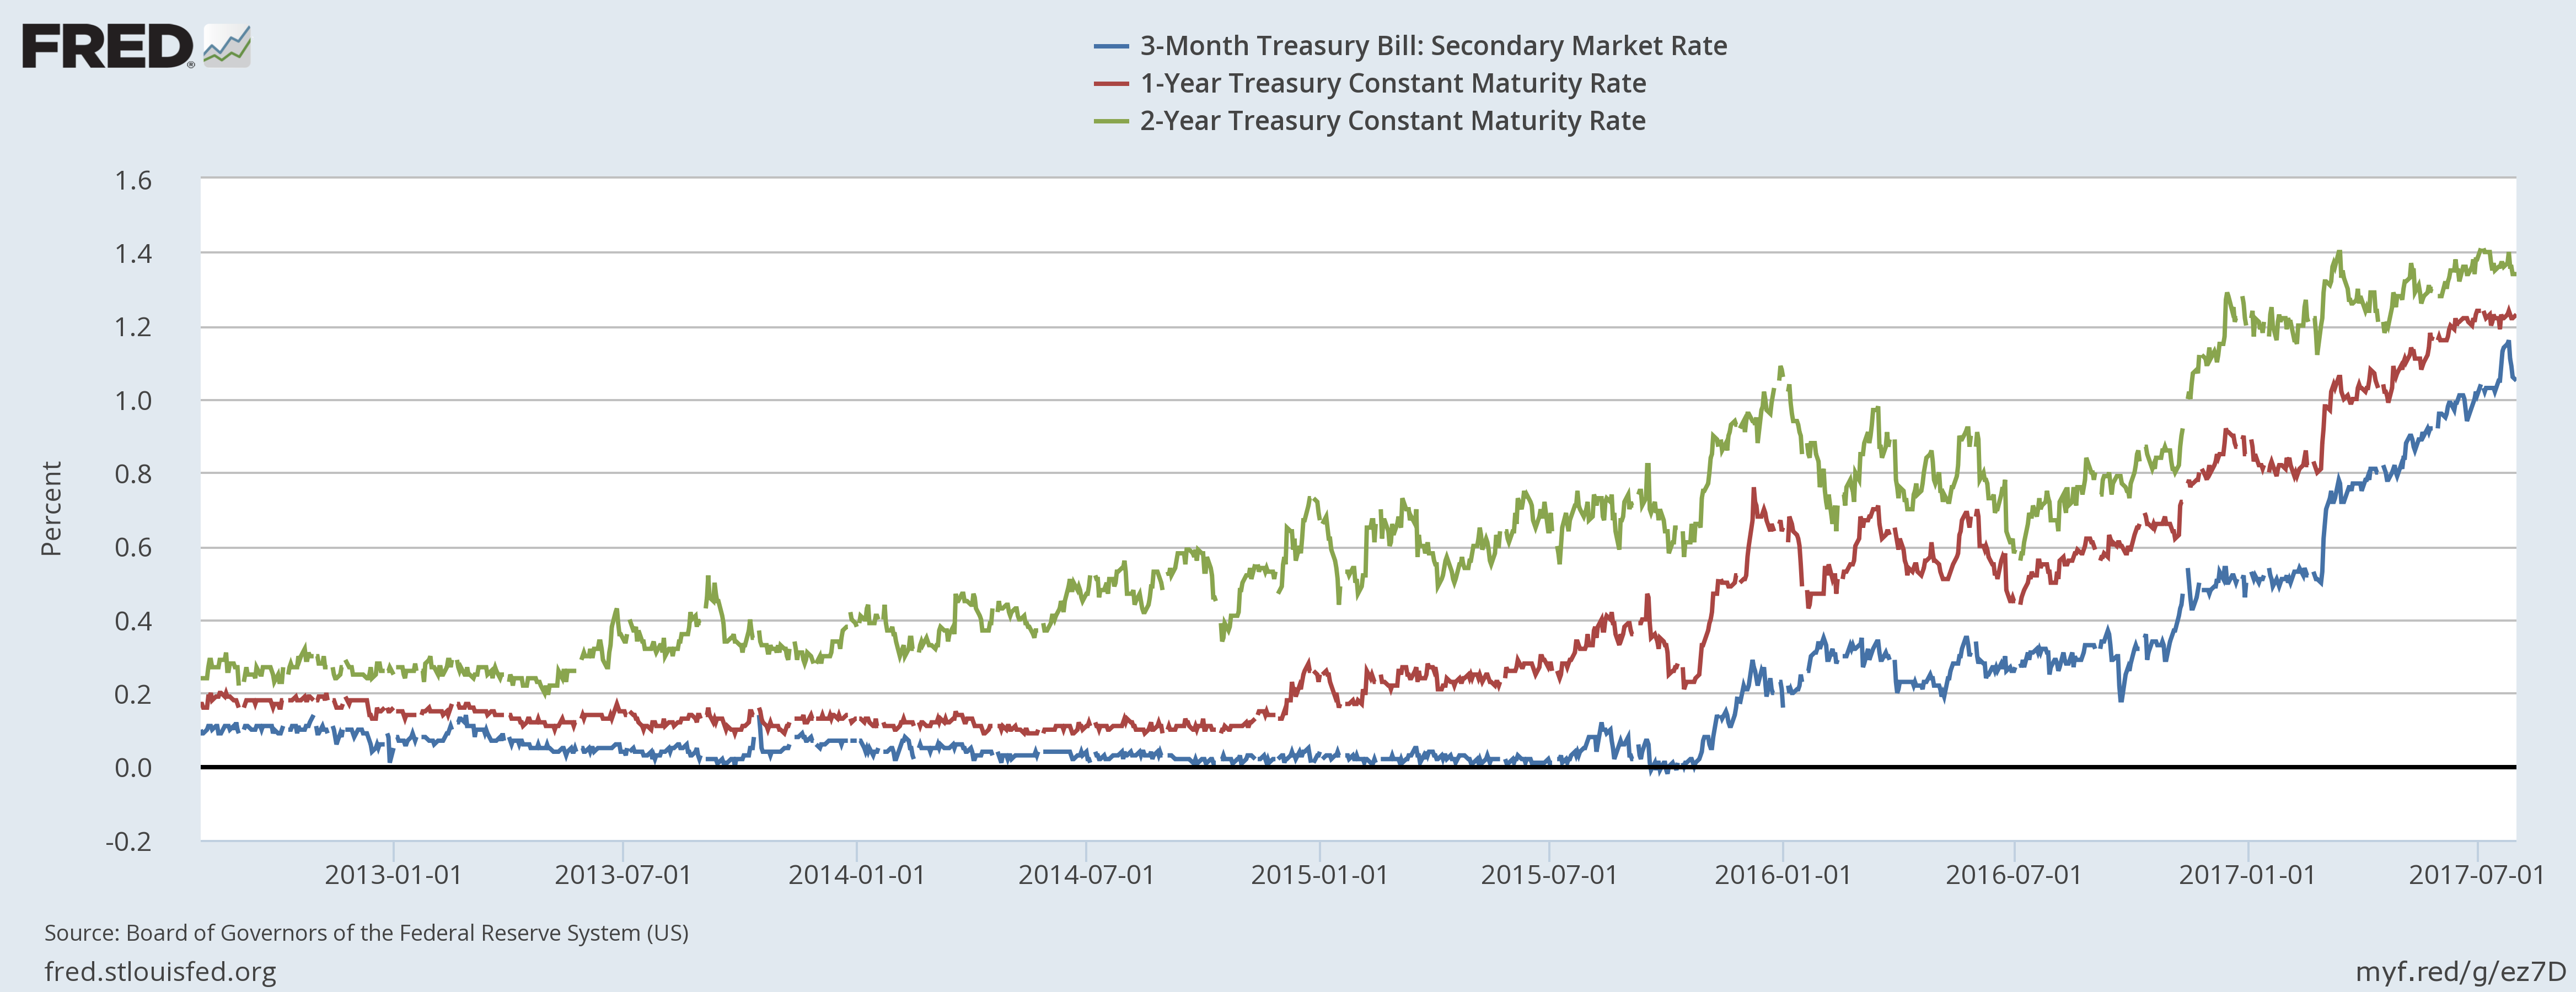
The 2-year treasury was the first to move higher; it made its initial move in early 2013, rising about 20 BPs to 40 BPs. It continued drifting higher until the beginning of 2015 when it used 60 BPs as a center of gravity. The taper tantrum at the beginning of 2016 spiked the entire treasury market, setting the 2-year 40 BPs higher. It rallied for the first half of 2016, then sold off a touch until the election, when the entire short-end of the curve sold off sharply. The 2-year has been selling off since and is now trading right around 140 basis points. The 1-year (in red) started moving higher at the very end of 2014 while the 3-month treasury (in blue) started moving higher at the end of 2015. Both the 1-year and 3-month had largely tracked the two year’s movements. The most important information on this chart is the large increase in basis points at the short end of the curve: the two year has risen approximately 120 basis points, the one year has widened about 100 basis points and the three-month treasury is up about 110 basis points.
The following chart places the above information into a historical context:
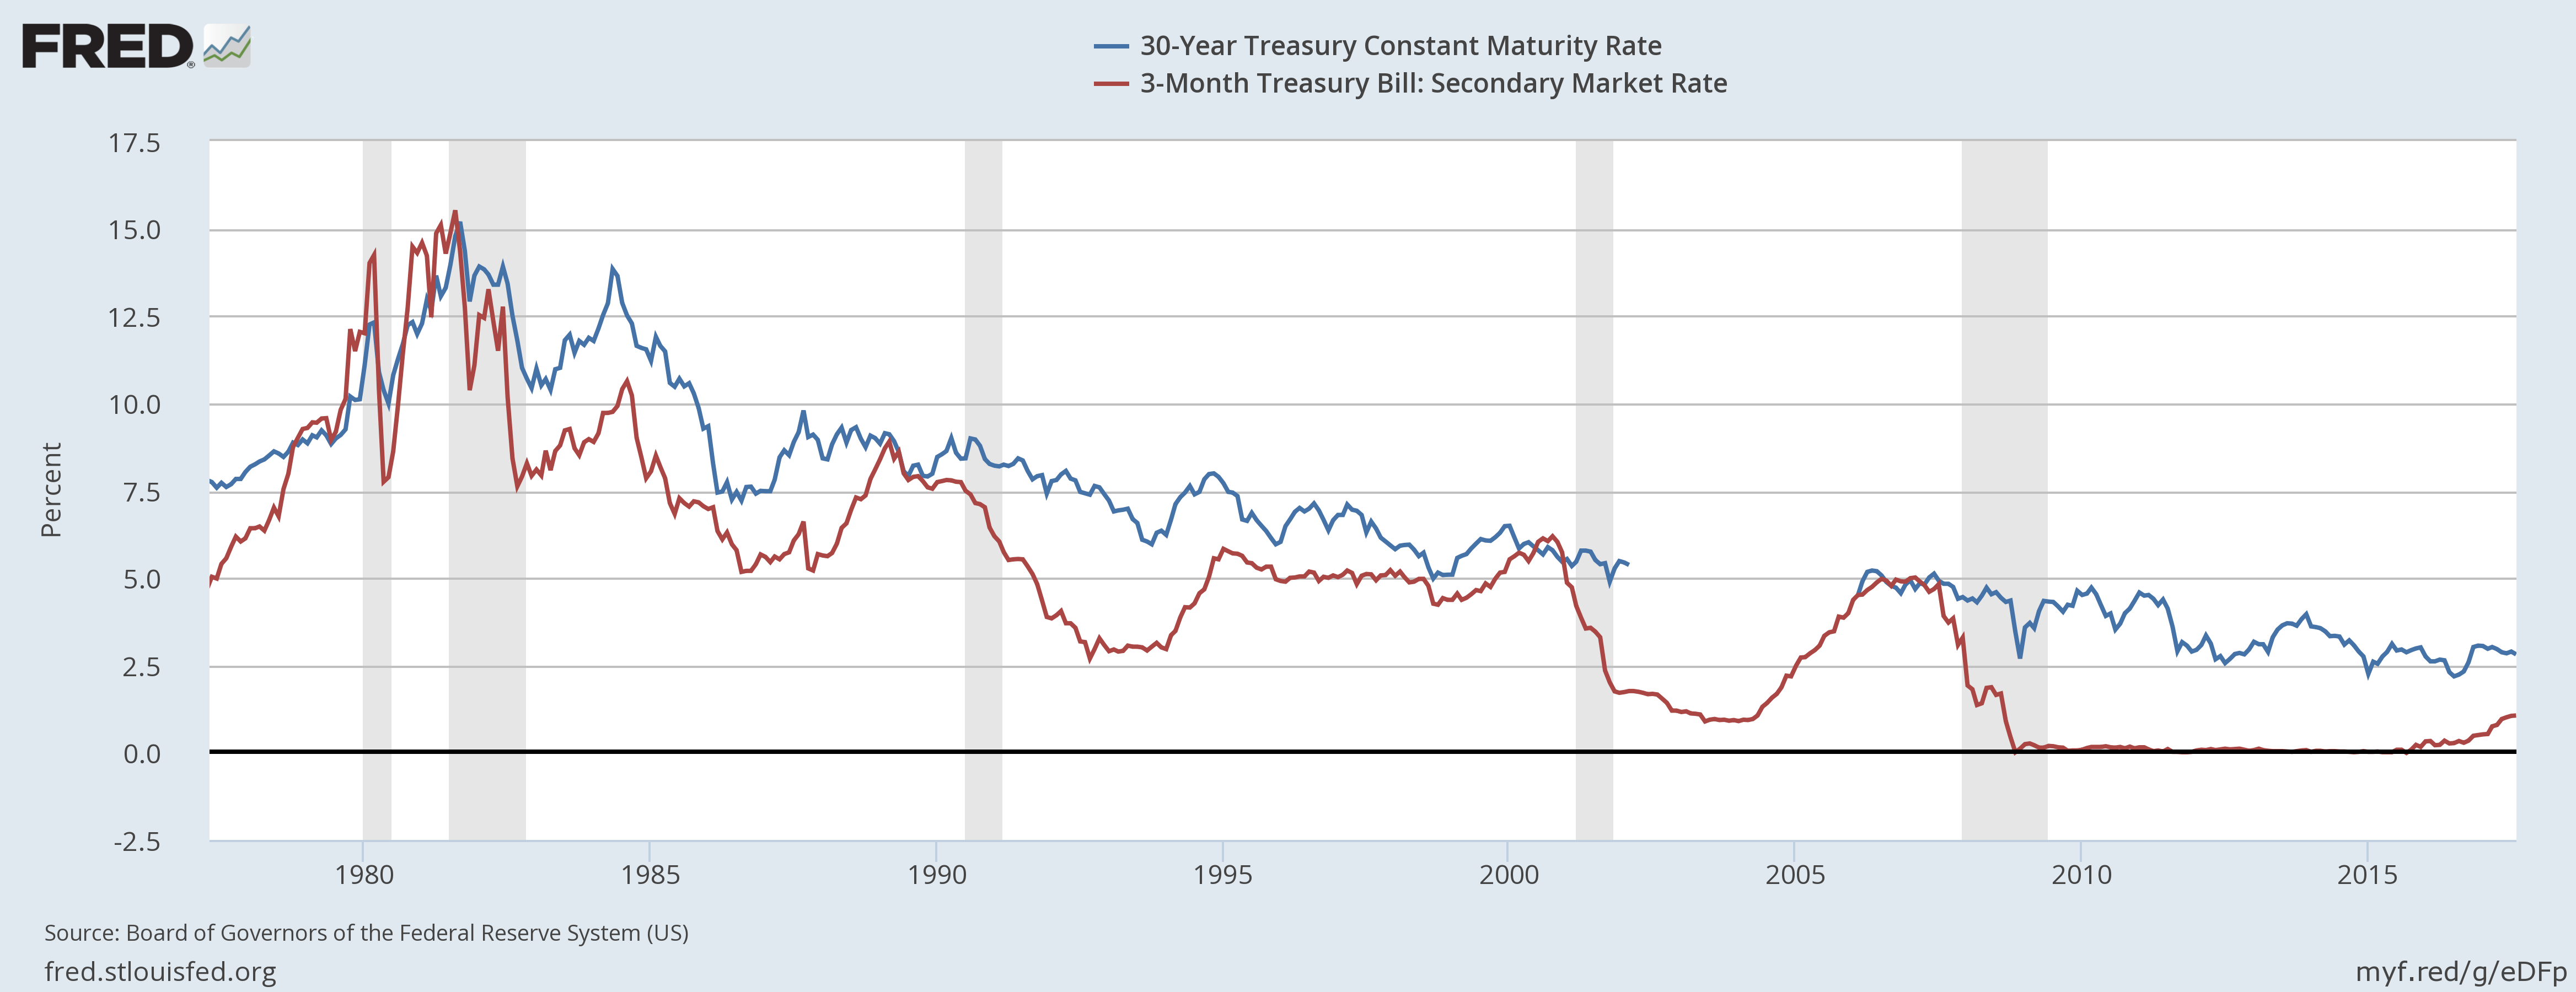
Starting since the expansion of the early 1980s, it is the movements in the short end of the curve that are mostly responsible for compression between the long and short-end, eventually leading to an inverted yield curve.
But, a funny thing happened while the short-end of the curve was moving higher:
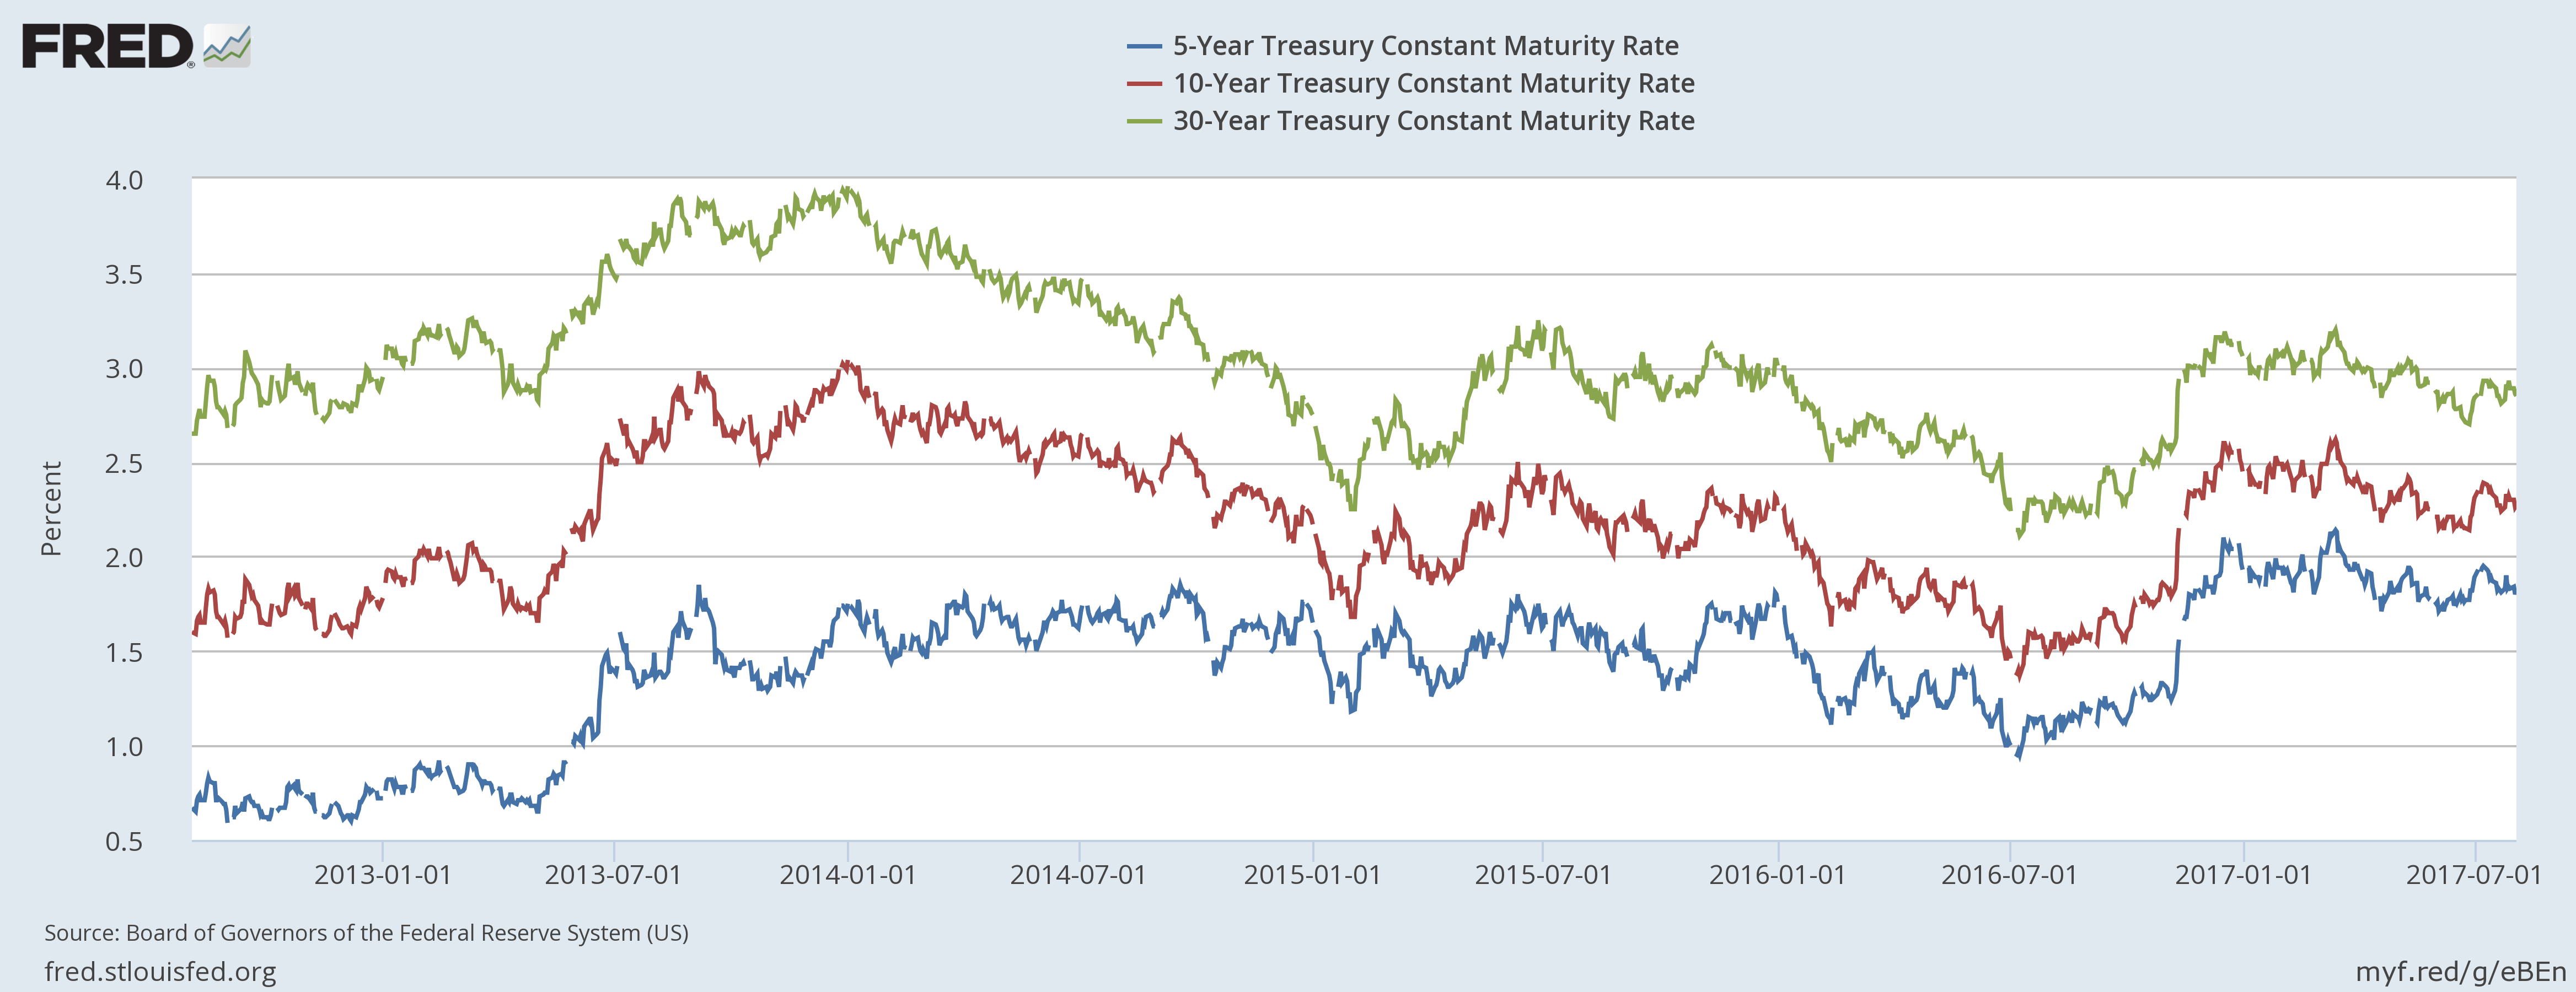
Since the election, the 5, 10 and 30-year treasury bond has moved higher, largely on expectations that Congress will grant tax relief, regulatory reform and some type of fiscal package. That has obviously not happened, but there is currently Congressional discussion about major tax reform, which is probably keeping the long-end of the curve higher for now.
If history is any guide, we’re still a ways off from a true inversion – at least 18-24 months. But if the Fed keeps tightening and Congress doesn’t deliver on any major programs, we could see some fairly sharp yield-curve compression over the next 12 months.
