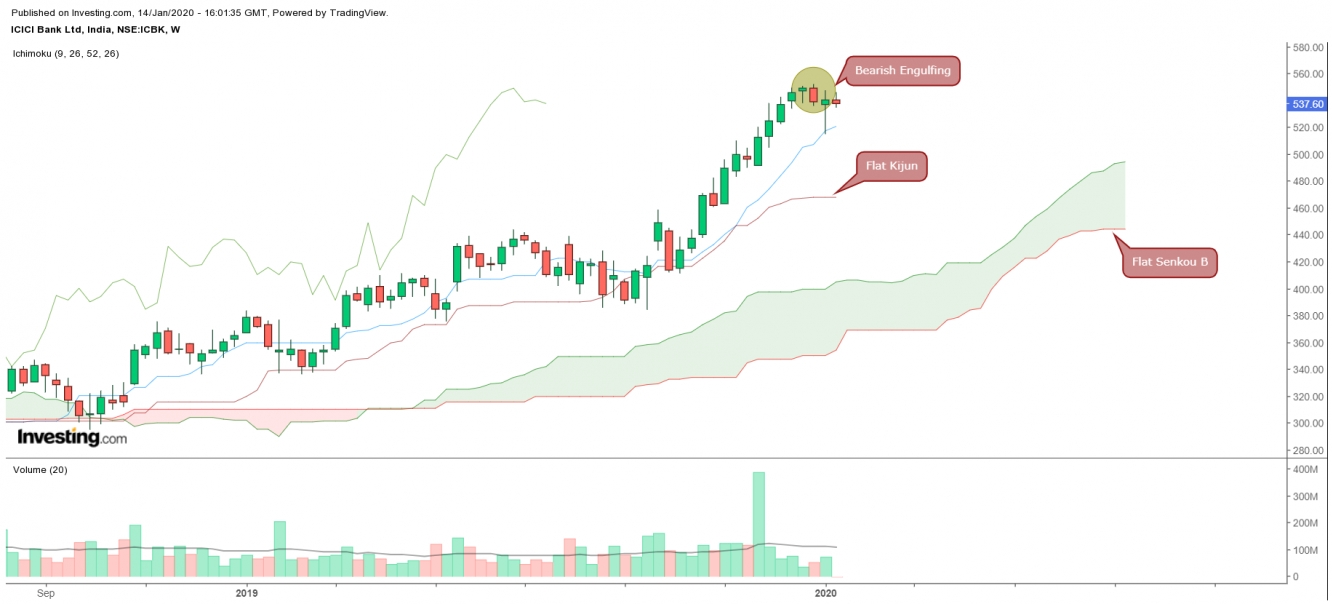
ICICI Bank (NS:ICBK) has formed a Bearish Engulfing Candlestick pattern in the weekly time frame.
Formation of such a pattern after a formidable rally signals the termination of the upmove.
In the days ahead 548-552 range is expected to act as strong resistance for price, a failed attempt to cross this range can result in a deep round of profit booking/correction in the stock price.
Ichimoku analysis: On the weekly chart Kijun has gone flat and is expected to pull the price lower, whereas the Senkou Span B has flattened out as well which suggests that price is retracing and the upward momentum has ended. In the next few weeks price is expected to slide lower and the test the supports offered at 498, 482 and 465 which are its retracement levels.

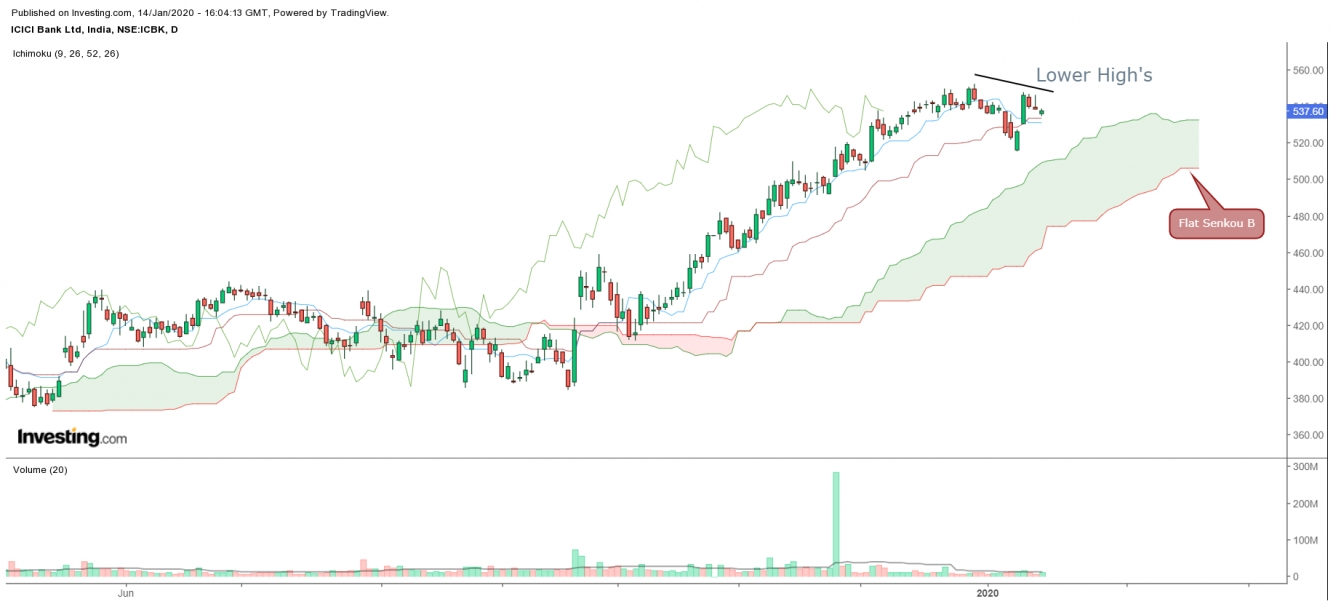
On the daily time frame too the lack of upside momentum is evident as price has made a lower high and its proximity to the cloud is increasing. Sustenance below 533 is expected to start a downmove till 510 which happens to be the cloud support.
The Oscillator RSI which measure the relative strength of an ongoing move has also stopper rising and is on the verge of falling below its overbought zone on the weekly time frame.

Our study on the charts is complimented by Open Interest Analysis which shows the highest build up on the Call side at 550 and 540. The Strike of 550 has been the holding the fort for writers and the recent addition in the position makes it even harder level to surpass.
Conclusion: The combine study of charts and OI clearly indicates that a top has been formed in ICICIBANK and now it is only a matter of time before the correction/Fall starts.
