AUDUSD
I am going to comment on this pair from an Ichimoku and Price Action perspective. Ichimoku first.
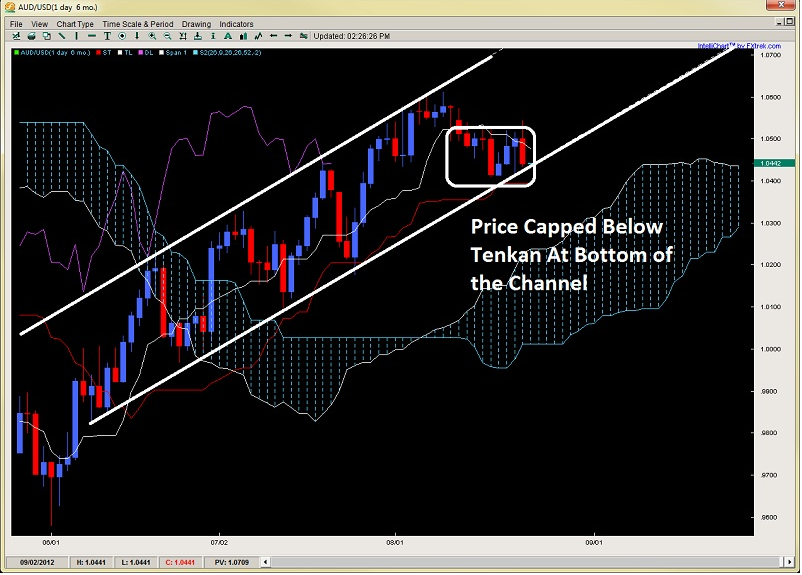
Although the pair is above the Kumo and Kijun, it has been sandwiched below the Tenkan for 8 days now. By itself this would be suggestive of weakness. But add how the price action has related to the channel and its more suggestive.
Look how the price action has responded to the bottom of the channel. Only in the first (of the last 4) approaches did it stall at the bottom. But each time it was rising quite steadily, along with the tenkan. Now the tenkan has been holding price for 8 days capping the upside. Combine that with how today’s selling pretty much erased 3 days of gains, only to be stopped by the channel bottom which is still in play.
Overall, the pair looks more likely to break the downside (of the channel) as it seems to be barely holding on at this point. Ichimoku traders can play an upside rejection towards the tenkan and yesterday’s highs, or wait for a break below the Kijun. Price action traders can take buys off the 5 day lows just above 1.0400 with tight stops, or look to sell just above 1.0530 on intraday weakness.
Global Market Commentary:
Stocks globally pulled back as the glimmer of the soon to be Fed stimulus wore off quickly, along with the weak data coming out of China and Europe also souring the mood. It should be noted Frau Merkal and France’s Hollandaise sauce just met with Samaras and told him no extra time or money is likely to be given to Greece.
China’s HSBC Flash PMI came in under expectations, along with the German and EuroZone PMI coming in soft. On the other side of the pond, the Initial Jobless Claims also did not help for risk on instruments.
The DOW lost 115pts which was its biggest drop in over a month, while Gold rallied $32 on the close and Silver broke $30 to close at $30.56, gaining 9.4% in the last 4 days, its strongest jump in 10mos. while Gold had its largest 3 day rally in 2mos.
Original Post
- English (UK)
- English (India)
- English (Canada)
- English (Australia)
- English (South Africa)
- English (Philippines)
- English (Nigeria)
- Deutsch
- Español (España)
- Español (México)
- Français
- Italiano
- Nederlands
- Polski
- Português (Portugal)
- Português (Brasil)
- Русский
- Türkçe
- العربية
- Ελληνικά
- Svenska
- Suomi
- עברית
- 日本語
- 한국어
- 简体中文
- 繁體中文
- Bahasa Indonesia
- Bahasa Melayu
- ไทย
- Tiếng Việt
- हिंदी
Ichimoku Forex Setup – Tenkan Caps Upside for Aussie. Aug. 23rd
Published 08/27/2012, 02:03 AM
Ichimoku Forex Setup – Tenkan Caps Upside for Aussie. Aug. 23rd
Latest comments
Loading next article…
Install Our App
Risk Disclosure: Trading in financial instruments and/or cryptocurrencies involves high risks including the risk of losing some, or all, of your investment amount, and may not be suitable for all investors. Prices of cryptocurrencies are extremely volatile and may be affected by external factors such as financial, regulatory or political events. Trading on margin increases the financial risks.
Before deciding to trade in financial instrument or cryptocurrencies you should be fully informed of the risks and costs associated with trading the financial markets, carefully consider your investment objectives, level of experience, and risk appetite, and seek professional advice where needed.
Fusion Media would like to remind you that the data contained in this website is not necessarily real-time nor accurate. The data and prices on the website are not necessarily provided by any market or exchange, but may be provided by market makers, and so prices may not be accurate and may differ from the actual price at any given market, meaning prices are indicative and not appropriate for trading purposes. Fusion Media and any provider of the data contained in this website will not accept liability for any loss or damage as a result of your trading, or your reliance on the information contained within this website.
It is prohibited to use, store, reproduce, display, modify, transmit or distribute the data contained in this website without the explicit prior written permission of Fusion Media and/or the data provider. All intellectual property rights are reserved by the providers and/or the exchange providing the data contained in this website.
Fusion Media may be compensated by the advertisers that appear on the website, based on your interaction with the advertisements or advertisers.
© 2007-2025 - Fusion Media Limited. All Rights Reserved.
