IBM (NYSE:IBM) has had a wild ride since its Watson artificial technology made a big splash on Jeopardy back in 2011. After that victory, IBM embarked on a long, downward trajectory that lasted until February 2016. After a minimal bounce it settled into a range again in April.
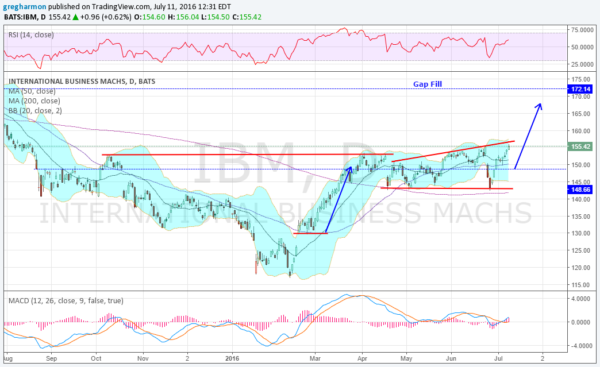
And it looks like that range has persisted to this day -- until you take a closer look, which reveals that IBM has made a series of higher highs since May against a stable low (a broadening wedge). Many think this is a bearish reversal pattern. But the fact is that its range can resolve either to the down or upside. And the preponderance of evidence today points to the upside.
Monday's chart shows that expanding wedge with price at the top. It also shows the Bollinger Bands® giving some room higher. The RSI is in the bullish zone and rising. And the MACD is crossed up and rising. A pattern break here would look for a move up to 169 or so. There is also a gap to fill to 172 above. And the Measured move would target about 168.
Keep an eye on IBM as it looks like Watson wants to join the rally.

