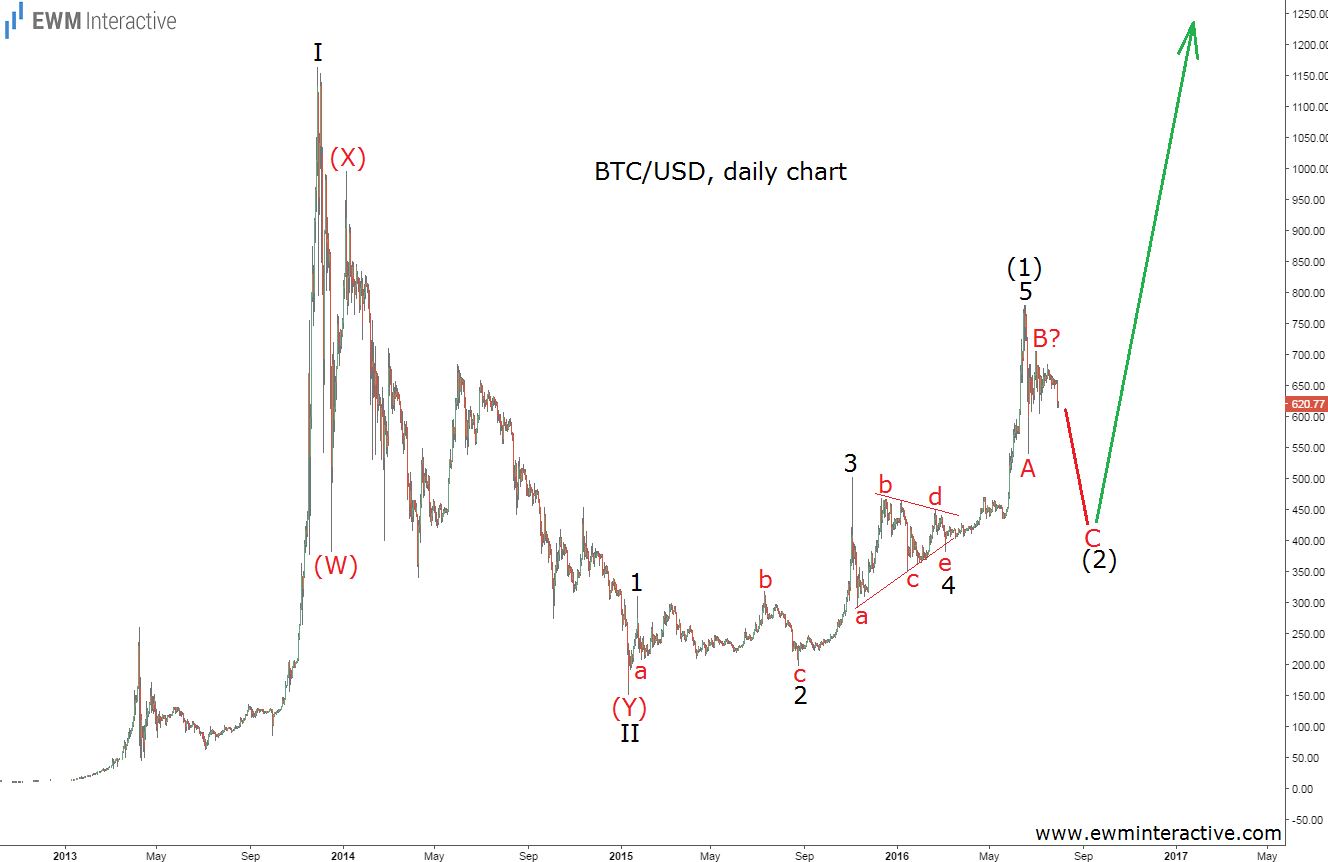
It has been a while since Bitcoin fell to 152 dollars in January, 2015. A year and a half later – in June, 2016 – it rose to 779 and reminded us of its best days in 2013, when it almost reached the 1200 dollar mark. BTCUSD currently stands slightly above 620 and now seems to be a good time to take a look at its charts and see what the Elliott Wave Principle has to say about it.
It does not look bad at first glance. The rally to 1163 in November, 2013, has to be wave I, followed by a (W)-(X)-(Y) double zig-zag correction in wave II. But what is more important is the fact that the latest recovery to 779 could be seen as a five-wave impulse, where wave 2 is an expanding flat correction and wave 4 is a triangle. Wave “a” of 4 is overlapping with wave 1, but its orthodox end – wave “e” – is not, so there is no violation of the Wave Principle’s rules.
If this is the correct count, the current weakness is supposed to be part of a three-wave A-B-C retracement in the position of wave (2). So far, wave C is still missing so we might see lower levels. The support area of wave 4 of (1) could be expected to discourage the bears and give the start of the next bullish phase – wave (3) of III. In other words, we should not be surprised if Bitcoin declines to 450 or even 400, but as long as the bottom at 152 holds, the outlook remains quite positive in the long term.
