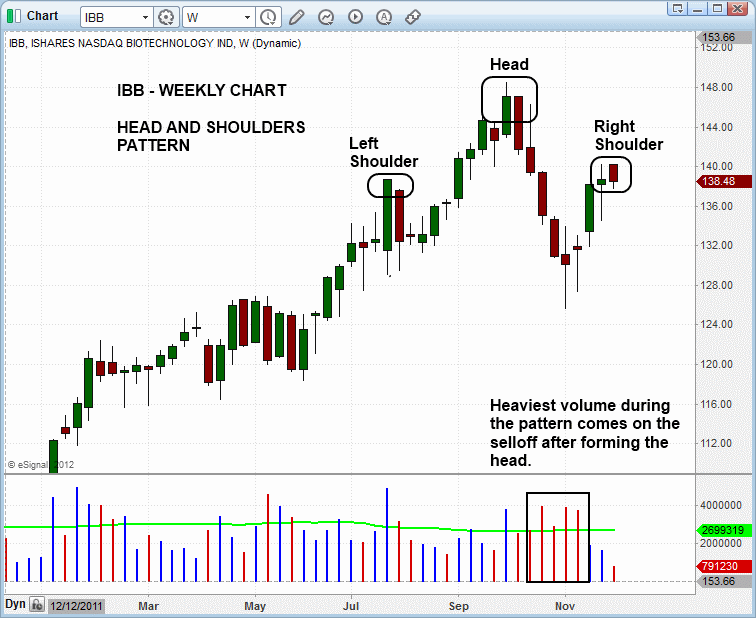
In the November 19 issue of The Wagner Daily newsletter, we initially pointed out that iShares Nasdaq Biotechnology ETF (IBB) may be in the process of forming a bearish “head and shoulders” pattern on its weekly chart. Now, after a month-long bounce off support of its 200-day moving average, IBB is forming the “right shoulder,” after stalling at resistance of its 50-day moving average the past few days. This is shown on the weekly chart of IBB below:
Notice how the recent highs of IBB over the past few days correspond to the highs of the “left shoulder.” The best quality head and shoulders chart patterns should form with a right shoulder that is equal to or less than the high of the left shoulder. For us, a head and shoulders pattern is no longer valid once the right shoulder extends much beyond the high of the left shoulder.
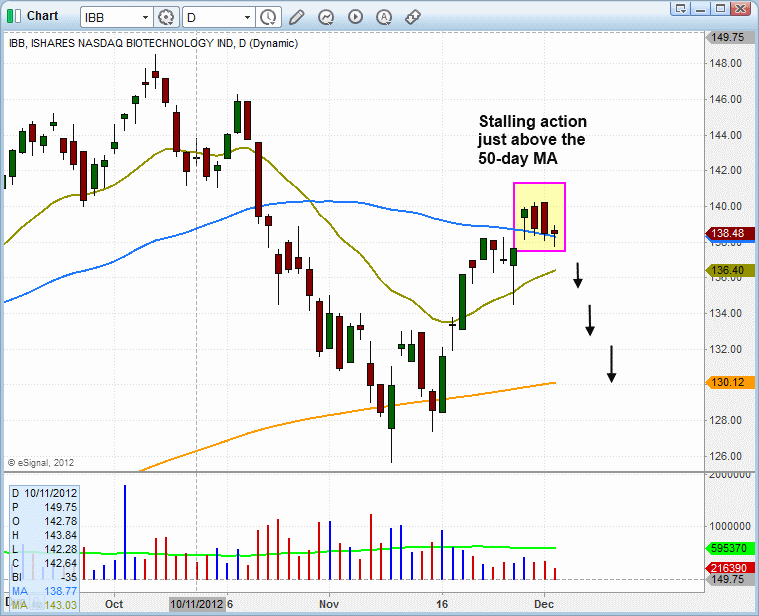
Drilling down to the shorter-term daily chart interval below, notice how the volume was heaviest on the decline from the top of the head to the bottom of the right shoulder. Higher volume on the sell-off from the top of the head, followed by lighter volume on the bounce that forms the right shoulder, is what we look for to confirm the pattern: 
Based on the weekly and daily chart patterns above, we have officially added IBB to our watchlist as a potential swing trade setup on the short side.
We mentioned recently that the broad market was showing signs of weakness during its current counter-trend rally off the lows, and one major concern is the lack of explosive price action in leadership stocks. If we were to focus only on the chart patterns of the major averages when analyzing the market, we would be missing a big piece of the puzzle, which is market leadership.
When our rule-based market timing model shifts to a new “buy” mode after a significant correction, our attention always turns to leadership stocks and how well they are breaking out from valid basing patterns. Are leading stocks breaking out on strong volume and holding up, or are they breaking out and selling off (false breakouts)? This information is critical to our decision making.
If leadership is strong, we can increase our long exposure, as well as our average share size per trade. But if leadership is weak and the market suffers a few “distribution days” (higher volume declines) over a short period of time, we are then forced to reduce long exposure and look for potential short setups. Though our market timing system is still showing a “buy” signal, we are now seeking the necessary confirmation for it to remain so.
Original post
- English (UK)
- English (India)
- English (Canada)
- English (Australia)
- English (South Africa)
- English (Philippines)
- English (Nigeria)
- Deutsch
- Español (España)
- Español (México)
- Français
- Italiano
- Nederlands
- Português (Portugal)
- Polski
- Português (Brasil)
- Русский
- Türkçe
- العربية
- Ελληνικά
- Svenska
- Suomi
- עברית
- 日本語
- 한국어
- 简体中文
- 繁體中文
- Bahasa Indonesia
- Bahasa Melayu
- ไทย
- Tiếng Việt
- हिंदी
IBB: Profit From The 'Head And Shoulders' Pattern In This Biotech ETF
Published 12/06/2012, 12:17 AM
IBB: Profit From The 'Head And Shoulders' Pattern In This Biotech ETF
Latest comments
Loading next article…
Install Our App
Risk Disclosure: Trading in financial instruments and/or cryptocurrencies involves high risks including the risk of losing some, or all, of your investment amount, and may not be suitable for all investors. Prices of cryptocurrencies are extremely volatile and may be affected by external factors such as financial, regulatory or political events. Trading on margin increases the financial risks.
Before deciding to trade in financial instrument or cryptocurrencies you should be fully informed of the risks and costs associated with trading the financial markets, carefully consider your investment objectives, level of experience, and risk appetite, and seek professional advice where needed.
Fusion Media would like to remind you that the data contained in this website is not necessarily real-time nor accurate. The data and prices on the website are not necessarily provided by any market or exchange, but may be provided by market makers, and so prices may not be accurate and may differ from the actual price at any given market, meaning prices are indicative and not appropriate for trading purposes. Fusion Media and any provider of the data contained in this website will not accept liability for any loss or damage as a result of your trading, or your reliance on the information contained within this website.
It is prohibited to use, store, reproduce, display, modify, transmit or distribute the data contained in this website without the explicit prior written permission of Fusion Media and/or the data provider. All intellectual property rights are reserved by the providers and/or the exchange providing the data contained in this website.
Fusion Media may be compensated by the advertisers that appear on the website, based on your interaction with the advertisements or advertisers.
© 2007-2025 - Fusion Media Limited. All Rights Reserved.
