Biotechnology sector has been in a corrective cycle for 12 months and it seems like that correction has ended. Our indicators are showing signs of bottoming but there is another last test - the next pullback towards $240-$250.
In the following charts, we will illustrate our primary and alternative Elliott Wave count together with medium-term price target & invalidation point.
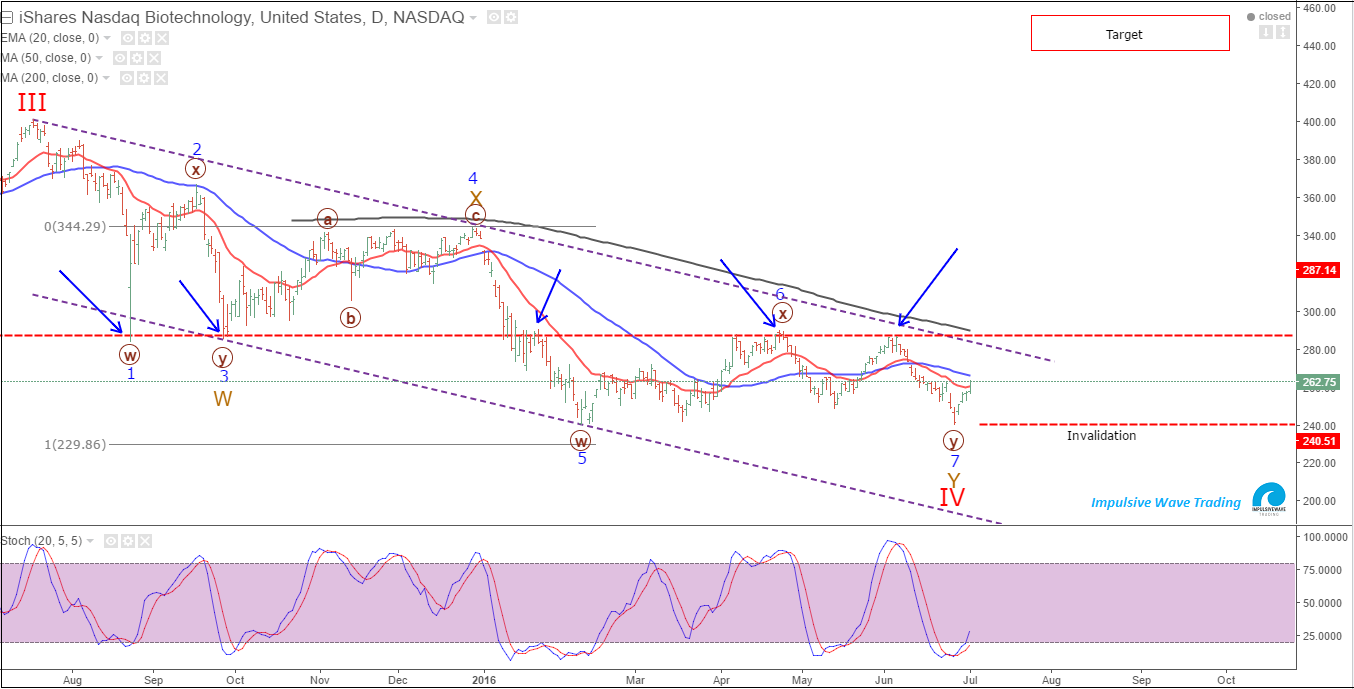
iShares Nasdaq Biotechnology (NASDAQ:IBB) - Daily Chart: July 04, 2016Elliott Wave Count - Technical Analysis
The corrective pattern of IBB is a double 3 that makes up the intermediate wave IV. Big wave Y completed its phase with the low at 240.30. Now 240.30 has turned into an invalidation level or the stop loss for swing longs.
In the above chart, $285 price area is shown as an important resistance level with 2 previous supports & 3 previous resistance tests. A break above that level indicates short-term bullish pressure that will test $320-$340 price zone.
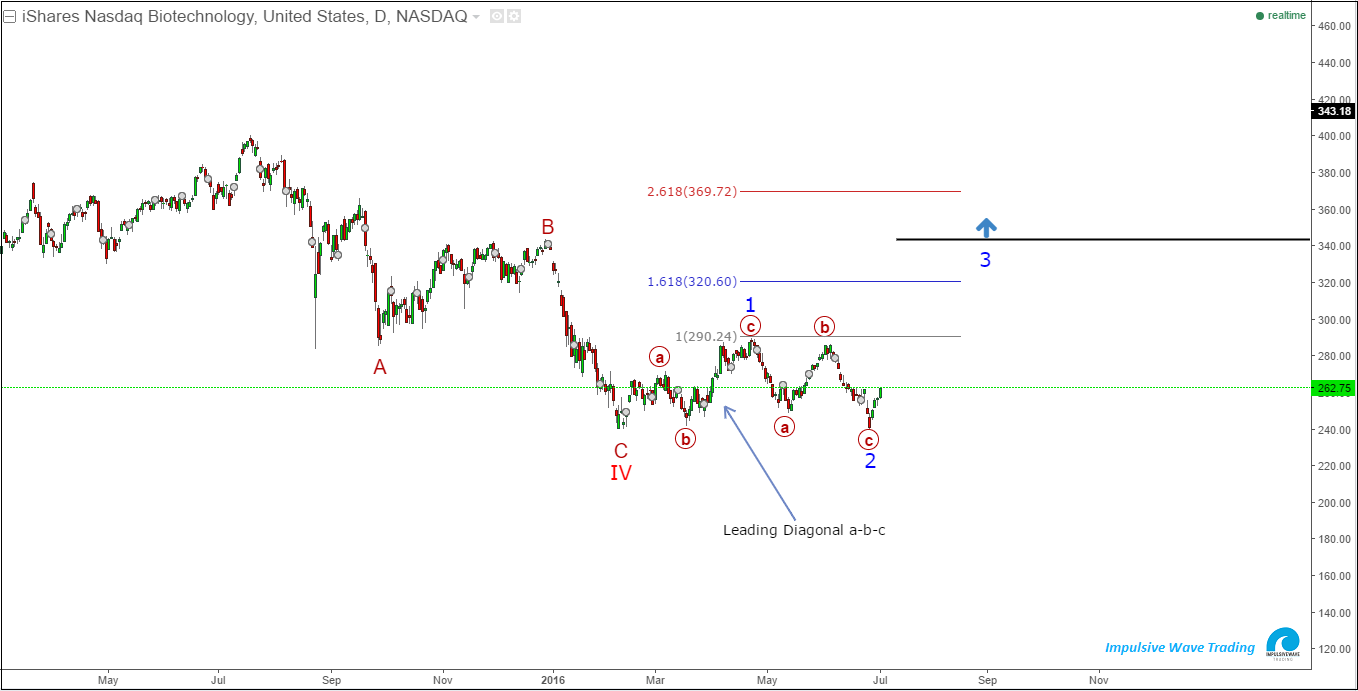
iShares Nasdaq Biotechnology, IBB - Daily Chart: July 04, 2016Elliott Wave Count - Technical Analysis - Alternative Count
In this chart, IBB has a 1-2 setup and wave 3 is ready to take off but first it needs a pullback towards $245-$250 and hold the previous low in wave 2 ($240 price level).
In both scenarios, IBB has a bullish medium-term outlook that targets $410-$440. Short-term important resistance levels are as follows:
- 20EMA - Red Line - Daily Chart 1
- 50SMA - Blue Line - Daily Chart 1
- 200SMA - Black Line - Daily Chart 1
- $285 price level.
