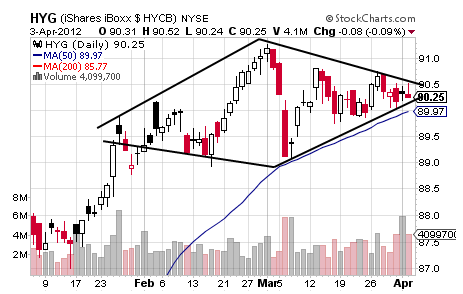
It should not be surprising that HYG is showing a rather clear version of the various topping patterns playing with the equity indices and certain sector ETFs.
What does make HYG’s Diamond Top at least a little surprising, and certainly interesting, is the fact that it has been trading out for more than two months now as compared to a little more than two weeks.Put otherwise, as the Nasdaq Composite has traded up nearly 10% over the last two months, HYG has simply consolidated for an essentially flat performance over the same time period and it is this type of spread that may be some indication of downside volatility to come in the risk assets with the aforementioned topping patterns providing the perfect path down.
Prior to looking at the downside case of HYG’s Diamond Top, let’s turn to its potential upside scenario that confirms at $91.29 for a target of $93.65 and a target that should be treated seriously if HYG closes above that upside confirming level. Relative to its more proper downside case, it confirms at $88.93 for a target of $86.57 with both the potential confirmation and fulfillment carrying special bearish significance.
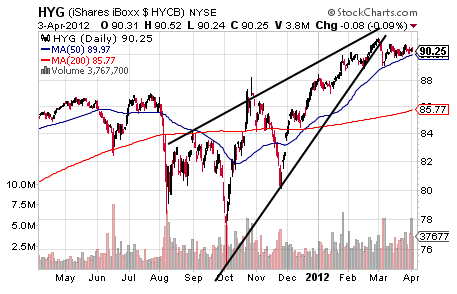
As can be seen in either of the two charts above, a possible confirmation of HYG’s Diamond Top would more than take HYG down below its 50 DMA and an event that has brought about some pretty decent drops over the last year while a fulfillment of that pattern would take HYG close to its 200 DMA with past precedents suggesting that such potential proximity could produce an outright spike down.
Such a possibility would seem to make sense in the context of HYG’s bearish Rising Wedge that appears to be trying to confirm and fulfill toward its target of $75.17 with the Diamond Top at hand to set this bigger bearish pattern in motion.
Unless HYG confirms its current consolidation to the upside, then, it seems that HYG is flashing a rather dangerous Diamond.
- English (UK)
- English (India)
- English (Canada)
- English (Australia)
- English (South Africa)
- English (Philippines)
- English (Nigeria)
- Deutsch
- Español (España)
- Español (México)
- Français
- Italiano
- Nederlands
- Português (Portugal)
- Polski
- Português (Brasil)
- Русский
- Türkçe
- العربية
- Ελληνικά
- Svenska
- Suomi
- עברית
- 日本語
- 한국어
- 简体中文
- 繁體中文
- Bahasa Indonesia
- Bahasa Melayu
- ไทย
- Tiếng Việt
- हिंदी
HYG: Flashing A Dangerous Diamond
Latest comments
Loading next article…
Install Our App
Risk Disclosure: Trading in financial instruments and/or cryptocurrencies involves high risks including the risk of losing some, or all, of your investment amount, and may not be suitable for all investors. Prices of cryptocurrencies are extremely volatile and may be affected by external factors such as financial, regulatory or political events. Trading on margin increases the financial risks.
Before deciding to trade in financial instrument or cryptocurrencies you should be fully informed of the risks and costs associated with trading the financial markets, carefully consider your investment objectives, level of experience, and risk appetite, and seek professional advice where needed.
Fusion Media would like to remind you that the data contained in this website is not necessarily real-time nor accurate. The data and prices on the website are not necessarily provided by any market or exchange, but may be provided by market makers, and so prices may not be accurate and may differ from the actual price at any given market, meaning prices are indicative and not appropriate for trading purposes. Fusion Media and any provider of the data contained in this website will not accept liability for any loss or damage as a result of your trading, or your reliance on the information contained within this website.
It is prohibited to use, store, reproduce, display, modify, transmit or distribute the data contained in this website without the explicit prior written permission of Fusion Media and/or the data provider. All intellectual property rights are reserved by the providers and/or the exchange providing the data contained in this website.
Fusion Media may be compensated by the advertisers that appear on the website, based on your interaction with the advertisements or advertisers.
© 2007-2025 - Fusion Media Limited. All Rights Reserved.
