The iPath Coffee ETN (JO) is an interesting exchange-traded product that provides investors with unleveraged exposure in the futures contracts on coffee.
Last month we bought and sold JO in our Wagner Daily newsletter for a solid gain of 19% over just a 6-day holding period.
In this educational blog post, I walk you step-by-step through the technical setup of that momentum-based swing trade of JO.
Fire Up The Percolator
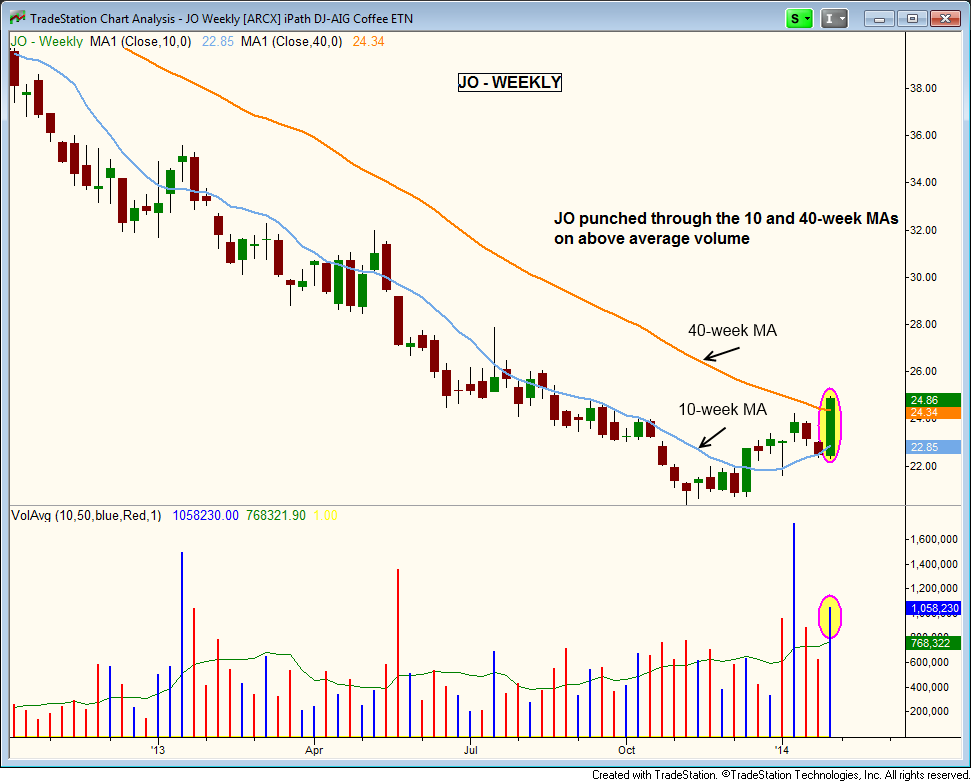
JO first made our internal watchlist at the end of January, after rallying to close above the 40-week moving average (similar to the 200-day moving average) on heavier than average volume.
The weekly volume pattern leading up to the breakout above resistance was bullish, with two strong weeks of accumulation (higher volume gains) in early January. This is important because we always want to see proof of institutional buying before entering a bullish trend reversal setup.
On the weekly chart of JO below, note the volume spikes that accompanied the bullish reversal back above the 40-week moving average:

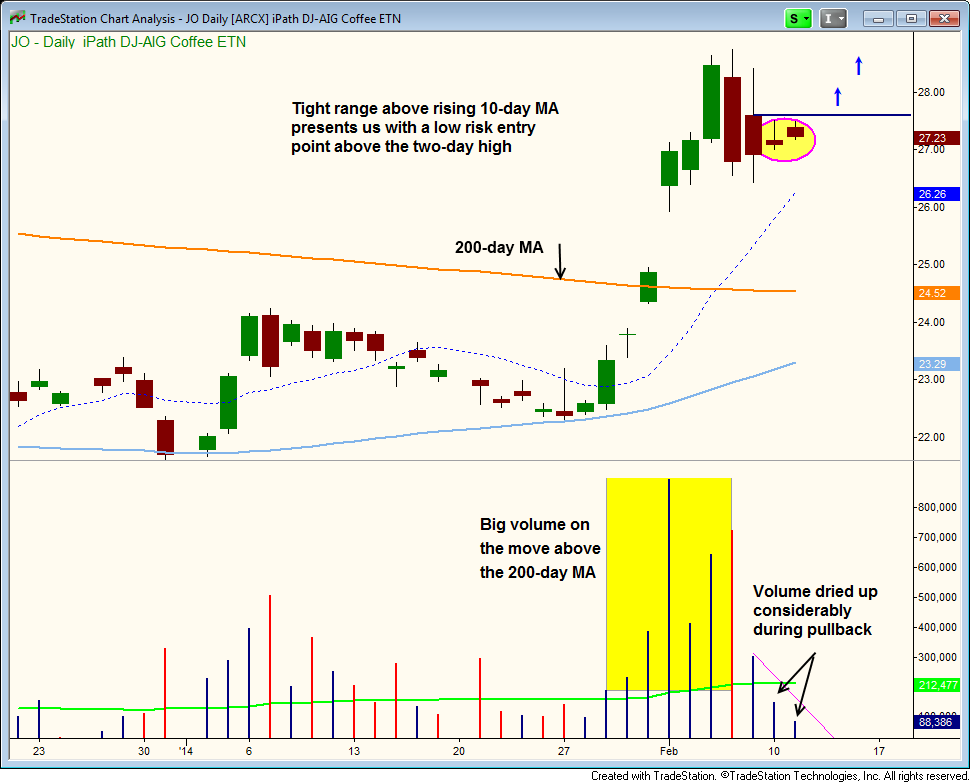
Drilling down to the shorter-term daily chart below, notice that JO followed through to the upside with impressive volume immediately after breaking out above its 200-day moving average. A few days later, the price stalled out and $JO began consolidating for a few days.
The price consolidation produced two very tight inside days, with volume dropping off considerably. Remember that lighter volume during consolidations is bullish because it indicates the bears are staying away while the bulls are taking a rest:

After such a strong rally higher (about 15% in just 3 days), the combination of tight price action and light volume that immediately followed was a very bullish sign that signaled additional upside in JO once the short-term consolidation was over.
On the night of February 11, we listed $JO as a potential buy entry in our Wagner Daily newsletter, with an exact buy trigger price just above the high of the two-day consolidation.
Providing support just below our buy trigger price was the rising 10-day moving average (dotted blue line on the chart above), which was catching up quickly up to the price.
“Your Coffee Is Ready To Be Served, Sir”
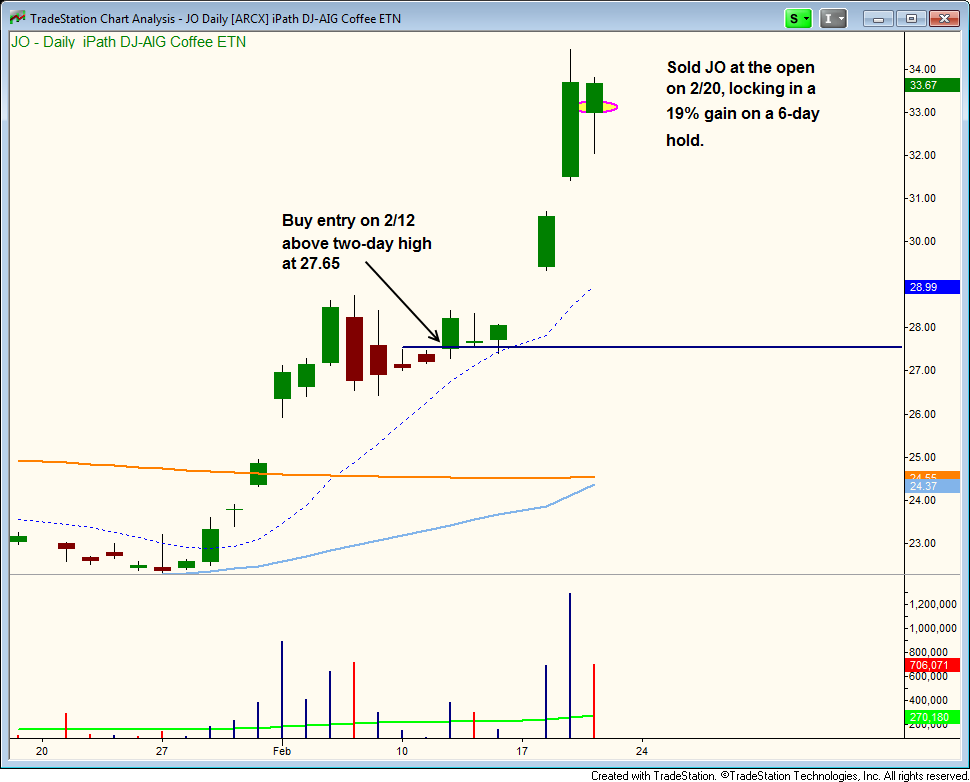
JO triggered our buy entry in the next session (February 12), then consolidated the rest of the week while holding above support of its 10-day moving average.
The following week, JO opened with a bang, ripping more than 20% higher in just two sessions (February 17 and 18).
Since our buy entry was on a pullback after the first rally, we were simply looking for a quick, momentum-based pop of 20% to 30%, which would roughly match the percentage gain of the prior wave up.
When JO stopped just shy of the $35-$36 resistance level on February 19, we decided to close the position the following day. This enabled us to lock in a profit of nearly 20% over a 6-day holding period.
Our actual entry and exit prices of the JO swing trade are shown on the daily chart below:

