Candlestick and bar charts are the most widely known types of graphs in finance. What about box charts? I had not even seen one before reading the trading book, “Trade Chart Patterns like the Pros”, written by Suri Duddella. Suri discusses about box charts in the first chapter and particularly when he analyzes his method called “Three Line Price Break”. His book has inspired me to come up with a trading system before. Now it’s time to spend time on box charts.

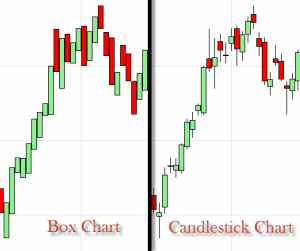
Box charts resemble a lot of the candlestick charts. It’s like the shadows (also known as wicks) of all the candlesticks are now part of the body. In effect the chart shows a series of boxes, as if they were candlesticks that opened at the lowest price and closed at the highest. So, how can we make use of these less-detailed candlesticks?
Suri presents a trading setup that signals a short entry when a black candle is printed after 3 white successive ones and a long entry when 3 black successive candles are followed by a white one. However current price must be traded below the lowest of the three candles when selling short and above the highest of the three candles when buying stock. Let’s scan the US stock market to find a couple of real-life examples. Note that NinjaTrader’s template for box charts print a green candle instead of a white and a red instead of a black one. Except if you are still using your favorite black and white monitor back from the 80’s.
Apple stock box chart
Believe it or not Apple (AAPL) stock chart was the first example it came up! Apple shares topped at $700 in September and they collapsed to $500 three months later. If you had studied Duddella’s book carefully by then, you should have noticed the red candle printed on 20th of September. The lowest price of the red box that was printed after 6 (!!) green successive candles was just a dollar lower than the lowest of the prior 3 candles, signaling a short entry.

Ideally we would have placed a stop loss a little higher than the previous high ($704), although Suri suggests placing the stop loss at the high of the breakout candle ($700). Unfortunately following Suri’s advice would stop us out and give up a promising setup. If we allowed our stop loss some space, we could have taken advantage of the downtrend that began after the reversal pattern.
According to the book, we should place a profit target at 2 times the length of the entry bar (breakdown). In this example the length of that particular bar is 7 dollars, leading to a profit target placed at $680, given we would have sold at $694. That target would have been hit three days later. If we had set the stop loss at $704 (risking $10 instead of 7), we should have taken our profit at $670, which was hit on the fourth day. What if we traded out half of our position there and let our winner run? In case of the Apple stock, the rewards may have been outstanding, as we would have actually sold at the absolute high! Obviously that is a rare example.
Markel Corp. stock box chart
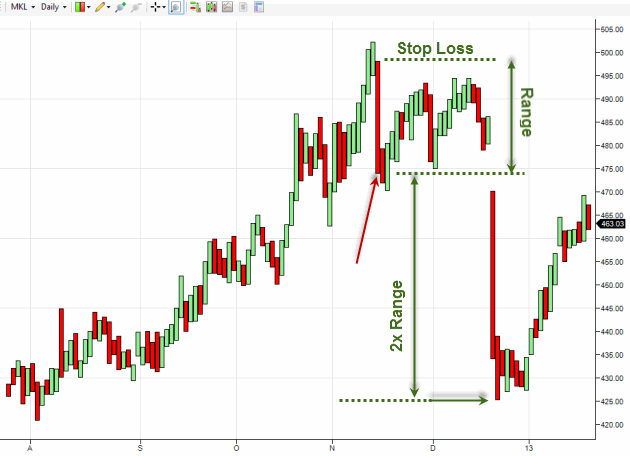
Markel Corporation stock (MKL) box chart is another sell-short example. The red candle in November was the signal according to the Three Line Price Break strategy. Since the candle’s range was about 25 dollars, the profit target would have been set $50 lower than the entry point at about $425.

Washington Post Company stock box chart
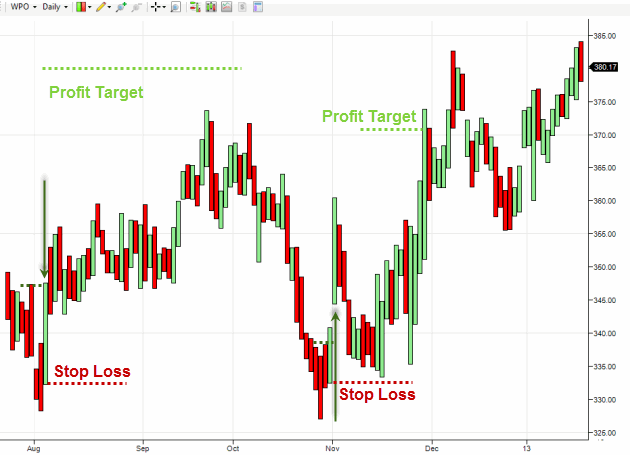
Two different signals to buy WPO stock can be found in the daily box chart of The Washington Post Company. The first was completed in August and the second in late October. In August we would have bought WPO for $348 a share, placing the stop loss at $332 and the profit target at $380. Although WPO shares reached $373, the profit target wouldn’t have been hit. In October we would buy WPO shares at $345 (always buy or sell on the next day so that the signal is confirmed when the market trades above the previous high or below the previous low respectively) and sell at $371, having placed the stop loss at $332.

BlackRock stock box chart
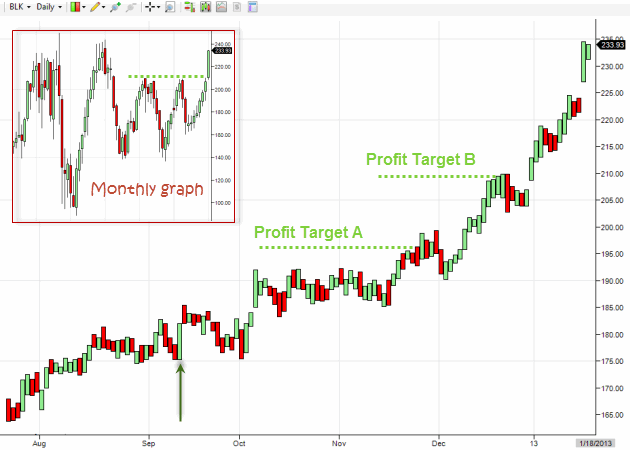
Here is another example of trading long following a signal of the Three Line Price Break method. BlackRock (BLK) stock has been trending upwards the last 6 months and traders could have made money if they bought BLK shares in September.

In this case I have placed one additional profit target that equals to 4 times the length of the breakout bar. I suppose one could trade out half of their position at the first profit target, 25% at the second and use a trailing stop for the remaining quarter. Note that the second profit target coincides with the resistance level indicated in the monthly graph!

Box charts resemble a lot of the candlestick charts. It’s like the shadows (also known as wicks) of all the candlesticks are now part of the body. In effect the chart shows a series of boxes, as if they were candlesticks that opened at the lowest price and closed at the highest. So, how can we make use of these less-detailed candlesticks?
Suri presents a trading setup that signals a short entry when a black candle is printed after 3 white successive ones and a long entry when 3 black successive candles are followed by a white one. However current price must be traded below the lowest of the three candles when selling short and above the highest of the three candles when buying stock. Let’s scan the US stock market to find a couple of real-life examples. Note that NinjaTrader’s template for box charts print a green candle instead of a white and a red instead of a black one. Except if you are still using your favorite black and white monitor back from the 80’s.
Apple stock box chart
Believe it or not Apple (AAPL) stock chart was the first example it came up! Apple shares topped at $700 in September and they collapsed to $500 three months later. If you had studied Duddella’s book carefully by then, you should have noticed the red candle printed on 20th of September. The lowest price of the red box that was printed after 6 (!!) green successive candles was just a dollar lower than the lowest of the prior 3 candles, signaling a short entry.

Ideally we would have placed a stop loss a little higher than the previous high ($704), although Suri suggests placing the stop loss at the high of the breakout candle ($700). Unfortunately following Suri’s advice would stop us out and give up a promising setup. If we allowed our stop loss some space, we could have taken advantage of the downtrend that began after the reversal pattern.
According to the book, we should place a profit target at 2 times the length of the entry bar (breakdown). In this example the length of that particular bar is 7 dollars, leading to a profit target placed at $680, given we would have sold at $694. That target would have been hit three days later. If we had set the stop loss at $704 (risking $10 instead of 7), we should have taken our profit at $670, which was hit on the fourth day. What if we traded out half of our position there and let our winner run? In case of the Apple stock, the rewards may have been outstanding, as we would have actually sold at the absolute high! Obviously that is a rare example.
Markel Corp. stock box chart
Markel Corporation stock (MKL) box chart is another sell-short example. The red candle in November was the signal according to the Three Line Price Break strategy. Since the candle’s range was about 25 dollars, the profit target would have been set $50 lower than the entry point at about $425.

Washington Post Company stock box chart
Two different signals to buy WPO stock can be found in the daily box chart of The Washington Post Company. The first was completed in August and the second in late October. In August we would have bought WPO for $348 a share, placing the stop loss at $332 and the profit target at $380. Although WPO shares reached $373, the profit target wouldn’t have been hit. In October we would buy WPO shares at $345 (always buy or sell on the next day so that the signal is confirmed when the market trades above the previous high or below the previous low respectively) and sell at $371, having placed the stop loss at $332.

BlackRock stock box chart
Here is another example of trading long following a signal of the Three Line Price Break method. BlackRock (BLK) stock has been trending upwards the last 6 months and traders could have made money if they bought BLK shares in September.

In this case I have placed one additional profit target that equals to 4 times the length of the breakout bar. I suppose one could trade out half of their position at the first profit target, 25% at the second and use a trailing stop for the remaining quarter. Note that the second profit target coincides with the resistance level indicated in the monthly graph!
