Forget the trade war noise. Here’s the only thing you need to know: if you’d bulked up your stock holdings on any of the dips we’ve seen in the last four years, you’d be a lot richer today.
Buying the Dip Amplifies a 65% Gain
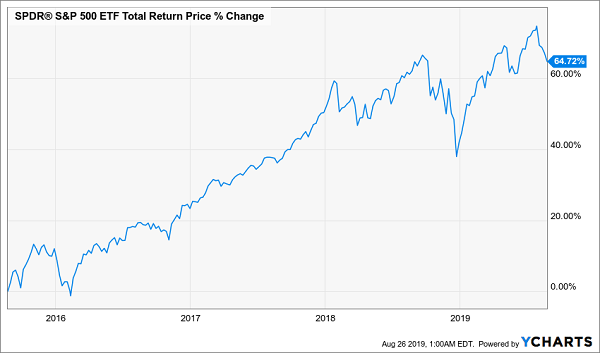
The reason for the market’s “one step back, two steps ahead” pattern is simple: despite the interest rate- and trade-driven terror, corporate profits and sales are rising (as are workers’ wages), and unemployment is low.
In other words, the US economy is solid—and it’s stayed solid through every short-term crisis of the last few years. So now we have another pullback that’s given us another chance to amplify our upside.
But what to buy?
You can easily get into the market with an index fund like the S&P 500 ETF (SPY (NYSE:SPY)), but there’s a problem: we want to have a nice stash of dividend cash to drop into stocks on the next pullback, and with SPY, your payouts are tiny, with just a 1.9% dividend yield.
This is where closed-end funds (CEFs) come in.
With an average yield of 7.4%, CEFs are much bigger income producers than the index, and three CEFs are particularly appealing right now, with overhyped fears making them unusually cheap.
Let me explain.
Because CEFs’ market prices can deviate from the value of the holdings in their portfolios (called the portfolio’s net asset value, or NAV), CEFs can trade at wide discounts to their NAV—even if the funds have a long history of strong performance.
That’s exactly what we’re seeing in the three funds I’m going to show you now.
Bargain CEF Pick No. 1: Buy Like Buffett (But With 209% Payout Growth)
Let’s start with the Boulder Growth and Income Closed Fund (NYSE:BIF), whose 3.9% yield is more than double that of the average S&P 500 stock, even though it’s actually on the small side for a CEF. Plus, BIF pays out special dividends every once in a while and has been aggressively increasing its regular quarterly payout, too:
BIF’s Dividend Triples—and Then Some
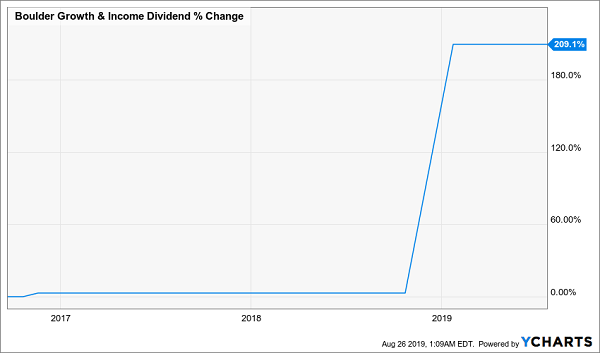
A 200% dividend-growth rate isn’t something you see every day, but BIF can do it because it focuses on stocks whose bargain valuations set them up to outperform over the long haul. It then returns those gains to you in cash.
To get that type of performance, it follows the teachings of the master—Warren Buffett.
In fact, a third of the fund is in Berkshire Hathaway B (NYSE:BRKb), so owning BIF is like getting Buffett’s portfolio at a big discount, as BIF trades 16.8% below its NAV. That makes it the third-most discounted CEF I track through our CEF Insider service.
Beyond Berkshire, BIF holds companies with strong cash flows that Buffett has also bought: names like JPMorgan (NYSE:JPM), Cisco (NASDAQ:CSCO) and Wells Fargo (NYSE:WFC). These firms can withstand an economic slowdown because of their strong balance sheets.
Bargain CEF No. 2: A 9% Dividend Disguised as 1%
General American Investors (GAM) also goes after bargain stocks, plus the fund is a bargain itself at a 14.5% discount to NAV. GAM is what I call a “stealth yielder”: while its normal dividend (paid annually) yields about 1%, the fund gives you the bulk of your cash through a big special dividend in December.
Years of Sudden Windfalls
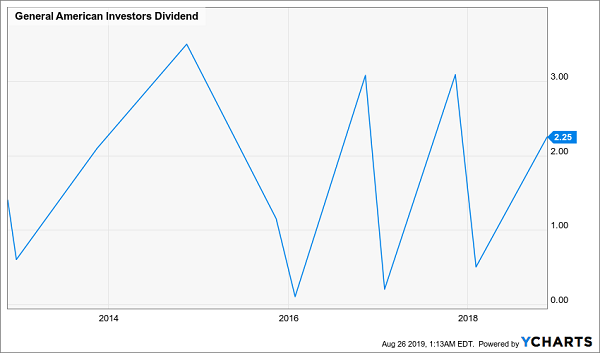
These special payouts are a big deal: they gave GAM an annualized yield of more than 9% last year, and a similar yield is likely in November, when the fund will announce its end-of-year payout.
What about the portfolio?
GAM, like BIF, is a value-focused fund, zeroing in on firms with strong cash flows, like Microsoft (NASDAQ:MSFT), Alphabet (NASDAQ:GOOGL) and Republic Services (RSG). That gives it a mix of high-performing tech stocks and stable cash generators from other sectors. This balanced approach is how GAM has been returned so much cash to shareholders over the years.
Bargain CEF No. 3: A Huge 7.7% Dividend Paid Upfront
The Nuveen Tax-Advantaged Dividend Growth Fund (JTD) takes a similar approach as BIF and GAM, but its “regular” dividend yields an outsized 7.7%, so you don’t have to wait for dividend hikes or special payouts to get your big yield here.
Plus, JTD trades at a 2.3% discount that, while smaller than those of GAM and BIF, is still far too big, given what the fund does.
JTD’s diverse portfolio ranges from Honeywell International (NYSE:HON) to SAP (SAP), UnitedHealth Group (NYSE:UNH) and AT&T (T). It also includes some tech, such as Microsoft (NASDAQ:MSFT). The fund’s global approach helps it find bargain-priced companies with entrenched client bases and stable revenues.
That’s why JTD has been crushing the market for a decade. And here’s the best part: only a few people know. If you look at the market-price movement for JTD, it seems pretty ho-hum:
First Looks Can Be Deceiving
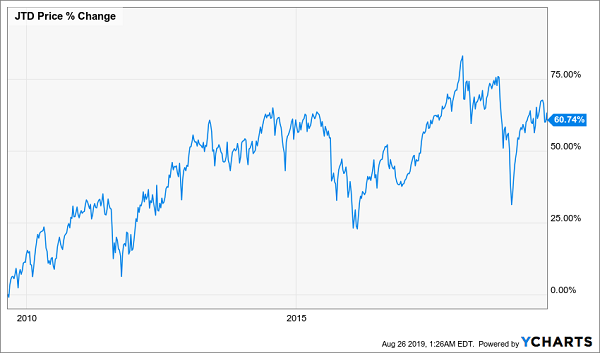
But this is without dividends. Add in JTD’s big payouts and the chart looks much better:
7.7% Payout Flips the Script
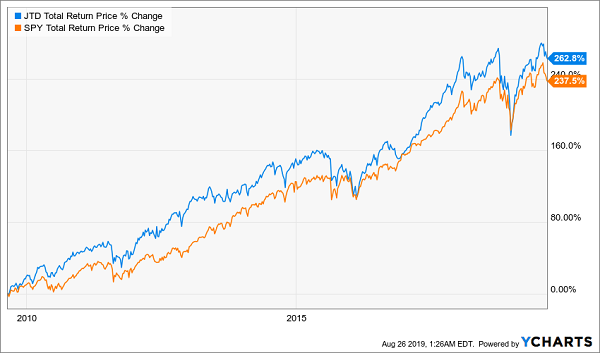
Not only has JTD soared over the last decade, it has also beaten the index, with a huge chunk of its return in cash, to boot. That means this fund shouldn’t trade at a discount at all—but the fact that it does means it’s certainly worth your attention now.
Here’s My Very Latest CEF Buy (120% Gains, 50% Dividend Growth)
This is the perfect setup for the pick I just released to members of my CEF Insider service last Friday—and want to give you right now.
It’s a tech fund that holds market dominators like Microsoft (NASDAQ:MSFT), Amazon (NASDAQ:AMZN) and Visa (NYSE:V). No matter what the government says, these tech “near monopolies” will boast miles-wide “moats” around their businesses for years to come!
In fact, overhyped regulatory fears have set up a one-time “contrarian discount” on this fund—which is why I’m pounding the table on it today.
Get this:
Big Tech’s “Hidden” Dividend
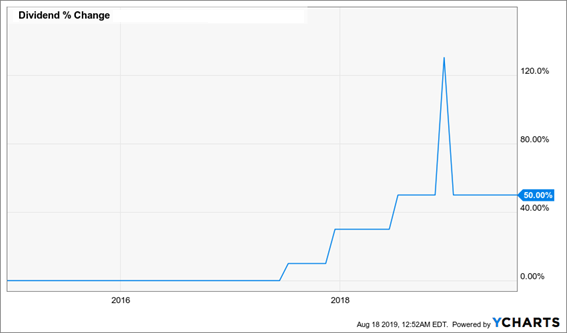
This dynamic fund’s price upside is just getting started, because it trades at a totally bizarre level in relation to its NAV. I’ve studied this weird price gap closely, and I’ve come to one conclusion: we’re nicely set up for fast double-digit gains here.
As I said, this fund is a brand-new CEF Insider recommendation—out for less than a week now—but there’s still time for you to get in.
All you need to do is grab the August CEF Insider. To do that, simply click here and I’ll give you an opportunity to grab yourself a no-obligation trial 60-day trial to the service, starting with the August issue, with this bargain cash-rich tech fund on page one!
That’s not all. I’ll also share with you my proven CEF-picking strategy and give you my five top CEF picks now (current average yield: 8%; forecast price upside: 20%).
Disclosure: Brett Owens and Michael Foster are contrarian income investors who look for undervalued stocks/funds across the U.S. markets. Click here to learn how to profit from their strategies in the latest report, "7 Great Dividend Growth Stocks for a Secure Retirement."
