A week ago, we noted to our members to keep a close eye on Freeport-McMoran Copper & Gold Inc (NYSE:FCX).
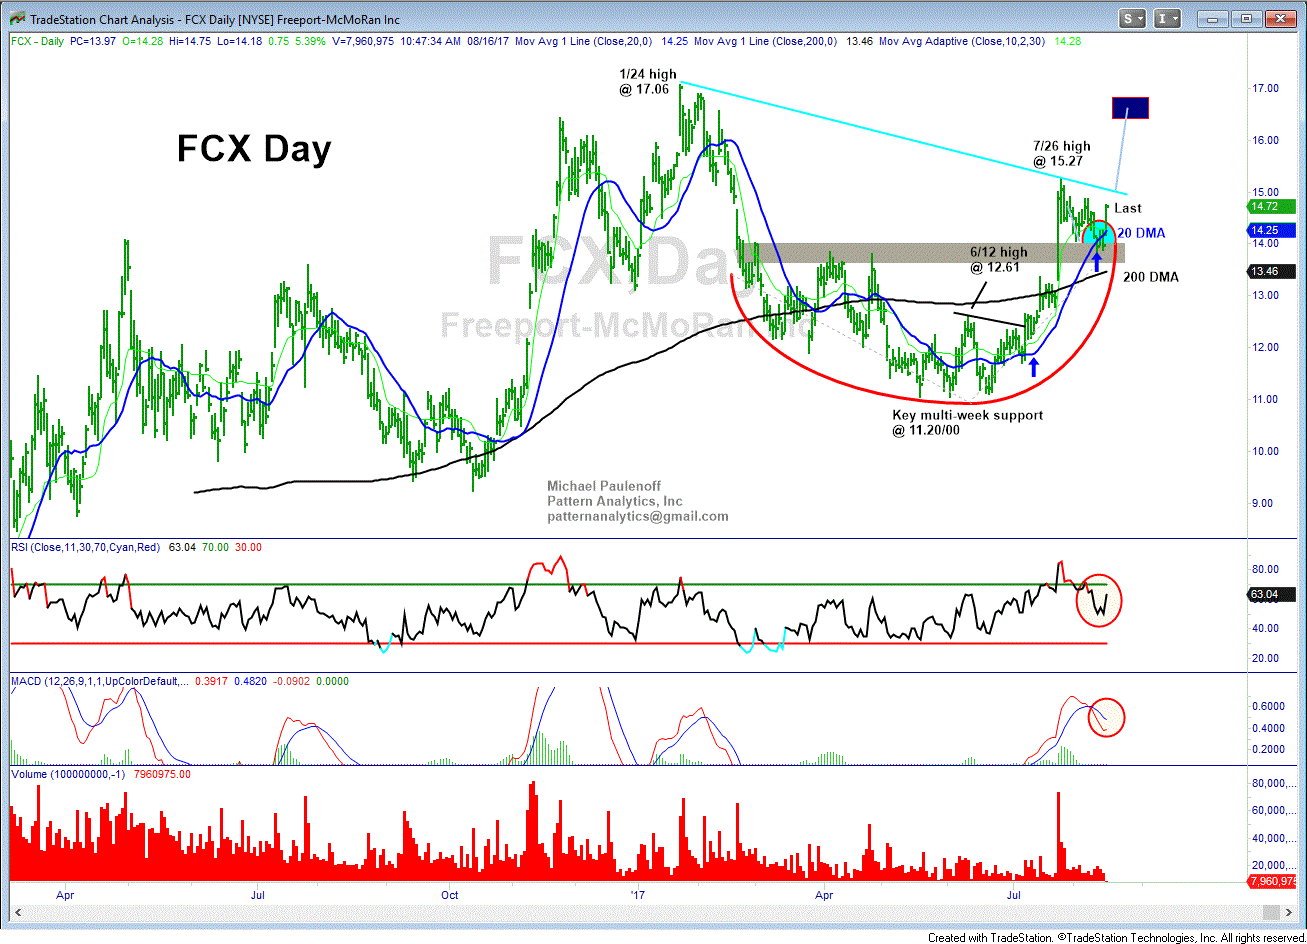
The chart pattern argued for the price to thrust into a new upleg after completing a 3-week correction.
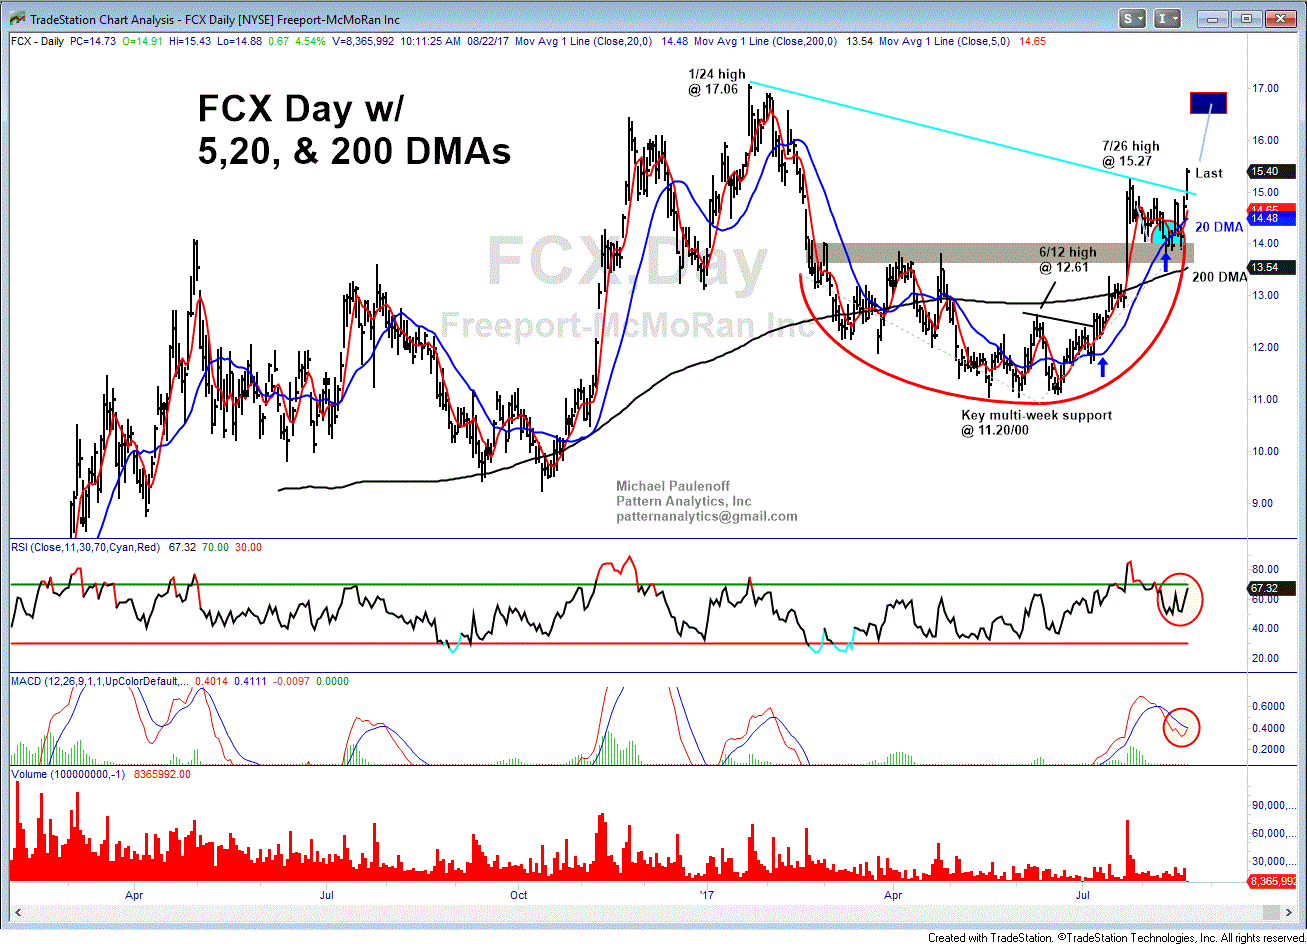
The correction, from 15.27 on July 26 to 13.81 on Aug 11, held key multi-month support, and positioned the chart into a bullish cup-and-handle formation.
Given the compelling technical set-up -- portending greater demand and inflationary pressures in copper and others metals -- we added FCX to our model portfolio on August 17 at 14.47.

The chart linked below shows the pattern, which included a bullish flag and the start of what appeared to be break out.
Five days later, JPM issued a bullish report about base metals prices, noting it was looking for better earnings in Century Aluminum Company (NASDAQ:CENX), Alcoa Corp (NYSE:AA), Teck Resources Ltd B (NYSE:TECK)...and FCX!

Meanwhile, Jefferies noted that materials stocks are "experiencing and enjoying underlying pricing power, a weak dollar, an expansionary China budget and M&A," even amid fears that President Trump’s infrastructure plans will be delayed or eventually diluted.
All of which helped spur a rally in FCX to a high of 15.46 on Tuesday August 22, with the stock closing at 15.07.
Where is FCX headed next?
FCX thrust above its January-August resistance line on Tuesday morning, taking out its prior rally high at 15.27. As long as the stock can sustain above 15.00, the price structure projects directly to 16.60-17.00 next.
