The last few weeks there have been some eye popping percentage moves in the CBOE’s VIX® index—these moves generated lots of headlines . As an antidote to the hype, a few savvy VIX followers noted:
“Remember that VIX is already a percentage.” Jared Woodward from Condor Options
“The VIX was up 2.08% today, NOT 18.5%” Mark Sebastian from Option Pit .
I have to admit that my brain spun a bit on Jared’s percent of a percent observation.
Yes, the VIX value is already a percentage—formally it’s an estimate of what volatility will be over the next 30 days that’s scaled up to be a full year’s forecast. So if the VIX is at 11.38 then the forecast is that the S&P 500 will fluctuate within +/-11.38% over the next year. Just like a weather forecast there’s also an estimate of how likely this forecast will be correct—in the case of the VIX it is always the same number—67%.
The VIX jumped 2.06 points from a close of 11.38 on 15-March-2013 to 13.36 on the 16th—that’s an impressive 18.5% move. But the annualized forecast only changed to +/- 13.36%—not something to hyperventilate about.
Percentages are useful for evaluating changes. If I say that XYZ stock is up 5 points it doesn’t mean much to the listener unless they know the starting point or basis. Is it a $10 stock, or a $505 stock? If I report XYZ’s increase as a percentage (e.g., 100% or 1%) I present a clearer picture.
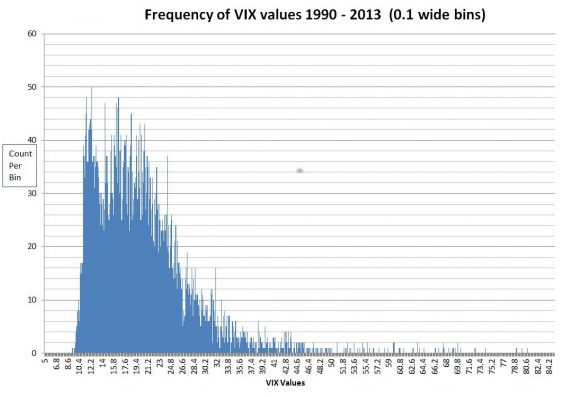
The VIX index is not like a normal stock—it won’t go to zero, and it tends to drift or revert towards a middling value (median of 19.05). The chart below shows the 5847 VIX closing values between 2-Jan-1990 and 20-Mar-2013 summed in 0.1 wide bins between 5 and 85.
What an ugly distribution! Don’t try to use your typical statistical tools (e.g., mean, standard deviation) on this beast! In the last 13 years the VIX has dropped as low as 9.3 only once, but it has closed between 11.1 and 11.2 thirty-nine times. During that time span it has only closed over 50 fifty-six times (0.96%).
Are the recent big percentage moves an indication of high market fear or is it more likely due to the VIX recently revisiting 5 year lows? With low values of the VIX a big percentage jump only requires a relatively small point move (e.g., A 3 point increase on a 10 point basis is +30%).
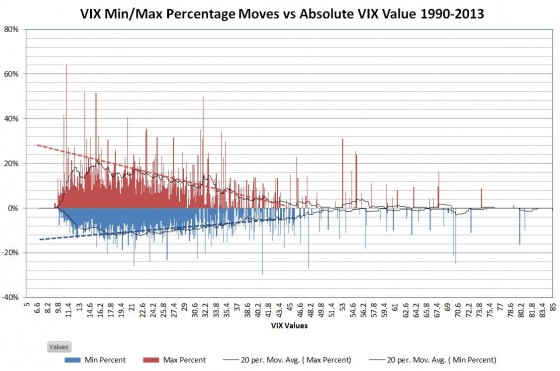
Pursuing that question I plotted the maximum positive and negative percentage daily swings in the VIX against the VIX value itself.
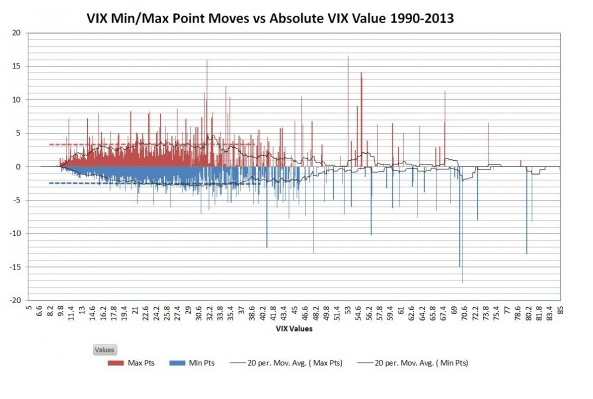
Not surprisingly the min/ max percentage moves do increase as the VIX level decreases. The next chart shows the min / max point moves (not percentage) in the VIX.
VIX values between 10 and 40 tend to have maximum moves in the +3 / -2.5 range, it doesn’t seem to matter much what the starting value of the VIX is.
Bottom line, history suggests that unless the VIX moves more than +/- 3 points nothing particularly noteworthy is happening.
On the other hand, if you are trading in VIX futures or volatility exchange traded products like the iPath S&P 500 VIX ST Futures ETN (VXX), ProShares Ultra VIX Short-Term Futures ETF (UVXY), C-Tracks Citi Volatility Index Total Return ETN (CVOL), VelocityShares Daily 2x VIX Short-Term Futures ETN (TVIX), or VelocityShares Daily Inverse VIX Short Term Futures ETN (XIV) (full list) you do care about VIX percentages.
Big VIX percentage moves usually aren’t matched by these products, but the leveraged products (UVXY, CVOL TVIX) often do a respectable job of tracking the big short term VIX moves.
- English (UK)
- English (India)
- English (Canada)
- English (Australia)
- English (South Africa)
- English (Philippines)
- English (Nigeria)
- Deutsch
- Español (España)
- Español (México)
- Français
- Italiano
- Nederlands
- Português (Portugal)
- Polski
- Português (Brasil)
- Русский
- Türkçe
- العربية
- Ελληνικά
- Svenska
- Suomi
- עברית
- 日本語
- 한국어
- 简体中文
- 繁體中文
- Bahasa Indonesia
- Bahasa Melayu
- ไทย
- Tiếng Việt
- हिंदी
How Meaningful Are VIX’s Big Percentage Moves?
Published 03/24/2013, 06:39 AM
Updated 07/09/2023, 06:31 AM
How Meaningful Are VIX’s Big Percentage Moves?
Latest comments
Loading next article…
Install Our App
Risk Disclosure: Trading in financial instruments and/or cryptocurrencies involves high risks including the risk of losing some, or all, of your investment amount, and may not be suitable for all investors. Prices of cryptocurrencies are extremely volatile and may be affected by external factors such as financial, regulatory or political events. Trading on margin increases the financial risks.
Before deciding to trade in financial instrument or cryptocurrencies you should be fully informed of the risks and costs associated with trading the financial markets, carefully consider your investment objectives, level of experience, and risk appetite, and seek professional advice where needed.
Fusion Media would like to remind you that the data contained in this website is not necessarily real-time nor accurate. The data and prices on the website are not necessarily provided by any market or exchange, but may be provided by market makers, and so prices may not be accurate and may differ from the actual price at any given market, meaning prices are indicative and not appropriate for trading purposes. Fusion Media and any provider of the data contained in this website will not accept liability for any loss or damage as a result of your trading, or your reliance on the information contained within this website.
It is prohibited to use, store, reproduce, display, modify, transmit or distribute the data contained in this website without the explicit prior written permission of Fusion Media and/or the data provider. All intellectual property rights are reserved by the providers and/or the exchange providing the data contained in this website.
Fusion Media may be compensated by the advertisers that appear on the website, based on your interaction with the advertisements or advertisers.
© 2007-2025 - Fusion Media Limited. All Rights Reserved.
